
HP Storage Essentials V5.1 User Guide First Edition (T4283-96026, August 2006)

Storage Essentials 5.1 User Guide 575
• Last 24 hours - Information collected in the last 24 hours is reported. This option is not
available to switches and storage systems.
• Last 7 Days - Information collected in the seven days is reported.
• Last Month - Information collected in the last month is reported.
• Last Year - Information collected in the last year is reported.
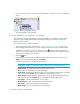
• Display data within a starting and ending time - You can format the graph to provide
data within the starting and ending time specified. Select the option to the left of the Start
field. Click the icon. In the Time field, type the time you want the graph to start. Use the
24-hour clock. Select a date and click Set. Repeat the steps for the End field. Then, click the
button to update the chart.
Important: If you change the date in the field to a date that does not exist in a month, the
software automatically calculates the date to the first day of the next month. For example, if
you enter 2003-11-31, the software assumes the date is 2003-12-01.
6. (Applications and Hosts only) To change the display frequency, select one of the following from
the Frequency drop-down combo box.
• Hourly - The information is displayed in hourly increments.
• Daily - The information is displayed in daily increments.
• Weekly - The information is displayed in weekly increments.
• Monthly - The information is displayed in monthly increments.
7. If the chart contains more than one series of data, you can filter out the additional data series
by clicking the button.
8. To add trending information, type an integer in the Trend field.
The integer corresponds to the number of frequency intervals for which the trending information
will be provided. For example, if you type 5 in the Trend field, the chart provides trending
information for five frequency intervals, such as five weeks if weeks was selected from the
Frequency drop-down combo box.
See ”Viewing Trending Information for Storage Capacity” on page 575.
9. Click the button to update the chart.
10.To print the chart, click the button displayed in the same pane as the chart.
Viewing Trending Information for Storage Capacity
The management server can display trending information in its reports. For example, you can
configure Capacity Manager to display trending information for the next week. This information
can give you an indication of an element's future capacity need based on its past capacity
utilization.
Keep in mind the following:
• An element's capacity can drastically change in the future. Please keep in mind the data trends
are just assumptions and should not be treated as fact.
• Trending requires at least two sets of data gathered within the frequency specified.