
HP StorageWorks Storage Mirroring Reporting Center user guide (T2558-96071, February 2008)


Storage Mirroring Reporting Center user guide 19
• “Printing reports” on page 20
• “Saving reports” on page 20
• “Emailing reports” on page 21
You can run reports from group objects or individual nodes in the Navigation tree. When generating a
report for a group object, the results include the data for all nodes within that group. In addition, you can
compare the performance of one object to another object by running comparison reports. To do this, select
multiple objects using Control + Click from the Navigation tree. The resulting report displays a comparison
of these two objects for the report specified.
Selecting a time period
You can set the reporting time period by choosing the reporting period from the Window drop-down
menu. The menu includes several common reporting periods. After selecting a window, the date and time
displayed to the right of the Time Window field is updated to reflect your selection. Available time periods
include:
• Last Day
• Last Hour
• Last Month
• Last Week
• Last Polled
• Since Start of Day
• Since Start of Month
• Since Start of Week
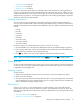
To specify a specific set of dates and times over which you want to run a report:
1. Click the Calendar icon to the right of the displayed time period. The Calendar dialog box appears.
2. Enter a specific date and/or time by clicking the date in each calendar (for start and end dates) and
choosing the hour and minute from the appropriate fields.
3. Click
OK. The display in the main window updates to reflect the time periods you select.
NOTE: After you change the timeframe, either click the Refresh icon or press F5 to update the data.
Selecting a node
To select a node in the Navigation tree, use the mouse to hover over the node you want to select and click
to select the node. If necessary, expand the Navigation tree to find the node. When a node is selected, it
is highlighted in the Navigation tree.
Selecting a report
To select a report:
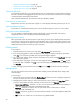
1. Right-click the node against which you want to run the report, and a menu displays your options.
2. Select an item from the menu.
3. The report runs (it may take a few seconds). While the report is running, the progress bar in the bottom
right of the dialog box moves to indicate that the report is in progress. When the report completes, the
report is displayed in the Report Display window.
Drilling down
When you run a report, you can drill down further to isolate problems or show more data about the
reported object. The way in which you drill down on data in reports depends on the type of report. The
following sections describe how to drill down to obtain more detailed data in the report types with the drill
down feature:
• “Trend chart drill down” on page 20
• “Zooming in on a chart section” on page 20