
HP StorageWorks Storage Mirroring Reporting Center user guide (T2558-96071, February 2008)

Storage Mirroring Reporting Center user guide 41
x-axis
The x-axis parameter is only available when configuring stacked bar charts. Use the x-axis parameter to
control whether the x-axis displays the values in the data set over time or displays the value at a
point-in-time.
To configure the x-axis settings of a bar chart:
1. Click
x-axis icon. The X Axis Editor dialog box appears.
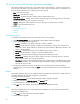
2. To specify whether the x-axis should display over time or at a point-in-time, choose either the
Time or
Value radio button. If you select point-in-time (Value), you can also choose how you want to group the
bars in the chart by selecting the fields returned in the data set.
3. Enter data in the following fields:
•
Type—Selects the type of x-axis. Whether it is a time axis or a value axis. Value axis allows
selecting fields by which you can group the stacked bar.
•
Field—Name of the field.
•
Group By—If selected, the field is added to the list used to group the stacked bars in the chart.
4. Select
OK to save your settings.
Horizontal bar chart appearance parameters
You can configure the following:
•
Title—Customize report titles
•
Report Filter—Filter the report results
•
Chart Styles—Configure the colors and fonts used in and around the chart. See “Series style editor” on
page 45.
•
Horizontal Bar Data Views—Configure different data views on a horizontal bar chart. See “Data views”
on page 39.
•
Horizontal Bar Series Styles—Configure the colors and styles used by data views in the chart. See “Series
style color editor” on page 45.
Pie chart appearance parameters
You can configure the following:
•
Title—Customize report titles
•
Report Filter—Filter the report results
•
Chart Styles—Configure the colors and fonts used in and around the chart
•
Pie Chart Fields—Select the fields to plot in the pie chart. See Pie chart fields editor.
•
Series Styles—Configure the colors and styles used by data series in the chart
•
Legend—Configure when legends will be displayed on a chart
•
Chart Label—Configure labels that are displayed in front of bars
•
3D Pie Options—Change the elevation and depth of the pie chart. This option is specific to pie charts
Pie 3D options
Pie 3D Options allows you to configure the elevation and depth of the pie chart. To configure these
options:
1. Click
3D Pie Option icon. The Pie Chart 3D Option Editor dialog box appears.
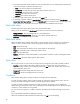
2. Change any of the parameters by sliding the relevant slide bar.
•
Elevation—Controls the viewing elevation of the chart. Lower value moves the viewing angle towards
the top.
•
Depth—Depth controls the thickness of the pie. A depth of zero makes the chart a 2D chart.
3. Click
OK to return to the Report Editor dialog box.