
Brocade Fabric Manager Administrator's Guide v6.1.0 (53-10000610-02, June 2008)


Fabric Manager Administrator’s Guide 105
53-10000610-02
Fabric event monitoring
7
• Select Between and use the windows to select the time frame window for the events
you want to see.
b. Click Filter to filter the events as specified.
Fabric event filtering
You can filter the fabric events that are displayed in the Events tab according to the number of
events you want to view, the severity level of the events, and the time frame.
Filtering fabric events for switches and fabrics
1. Select a fabric, switch, or the entire SAN in the View panel, as described in “Fabric event
monitoring” on page 102.
2. Click the Events tab in the Information panel.
3. Select the filter options. You can filter by any of the columns shown in the panel. You might
need to resize the panel to display all of the columns.
a. Select the number of events to display from the Number of events list.
b. Select the column containing the information you want to include from the Filter on
Column list.
c. Type the value limitations in the text field. For example, if you select Severity, you might
type Info, Warning, or Critical.
4. Click Filter.
The Events tab displays only those events that match the selected criteria.
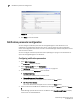
Filtering fabric events for switch groups
1. Access the switch groups event list, as described in “Fabric event monitoring” on page 102.
2. Click Events in the view selection panel on the right side of the window.
3. Click Filter in the Events view panel.
4. Check the appropriate check boxes to filter events by number, severity, and time, and select
values from the corresponding menus.
5. Click OK.
The Events panel displays only those events that match the selected criteria.
NOTE
When filtering events by the last 100 numbers for FICON-enabled switches, all existing RLIR events
could be displayed. For some switches, all 100 events displayed in the table may be RLIR events.
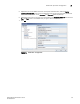
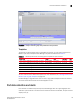
Viewing event details
1. Open the Events tab and make any filtering selections needed.
2. Double-click the row on which the event appears. The Event Details window displays, as shown
in Figure 70.