
Brocade Fabric Manager Administrator's Guide v6.1.0 (53-10000610-02, June 2008)


Fabric Manager Administrator’s Guide 113
53-10000610-02
Port data collection and alerts
8
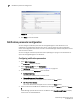
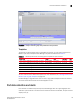
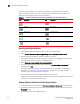
FIGURE 73 Example real time graph with performance and port data
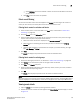
Templates
To generate an ongoing report without a specified time interval, you can create a Performance
Monitor report from a template. Fabric Manager templates are described in Table 11.
You can create and save additional templates. For more information, see “Creating a Performance
Monitor report or graph template” on page 122.
If Fabric Manager is upgraded from v5.2.x to v5.3.x, any graphical templates that were created in
the earlier version for Port Stats cannot be displayed in v5.3.x
Port data collection and alerts
Port statistics are collected only for FC ports; Fabric Manager does not support GigE port data
collection. If port statistics is turned on but the switch has become unreachable, the port statistics
display a zero (0).
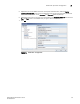
TABLE 11 Default performance monitoring report templates for port statistics
Report name Format Time Granularity Filter
“Top N” of Ports (Aggregate Tx/Rx Traffic) over time T Display (HTML) Last 1 hour 5 minutes None
“Top N” of Ports (Aggregate Tx/Rx Traffic) over time T Display (HTML) Last 30 minutes 5 minutes None
“Top N” of Ports Receiving (Rx) traffic over time T Display (HTML) Last 1 hour 5 minutes None
“Top N” of Ports Receiving (Rx) traffic over time T Display (HTML) Last 30 minutes 5 minutes None
“Top N” of Ports Generating (Tx) traffic over time Display (HTML) Last 1 hour 5 minutes None
“Top N” of Ports Generating (Tx) traffic over time Display (HTML) Last 30 minutes 5 minutes None