
Brocade Web Tools Administrator's Guide - Supporting Fabric OS v7.0.0 (53-1002152-01, March 2012)


108 Web Tools Adminstrator’s Guide
53-1002152-01
Opening the Performance Monitoring window
8
Canvas configurations
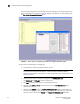
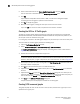
A canvas is a saved configuration of graphs. The graphs can be either the Web Tools predefined
graphs or user-defined graphs. Each canvas can hold up to eight graphs per window, with six shown
in Figure 21. Up to 20 canvases can be set up for different users or different scenarios. Each
canvas is saved with a name and an optional brief description.
FIGURE 21 Canvas of six performance monitoring graphs
Opening the Performance Monitoring window
To perform performance monitoring, you must use Web Tools with the EGM license; otherwise,
when you click on the Performance Monitor tab, access to this feature is denied and an error
messages displays.
To open the Performance Monitoring window, perform the following steps.
1. Select a switch from the Fabric Tree and log in when prompted.
2. In the Monitor area under Tasks, click Performance Monitor. The Performance Monitoring
window displays.