
Brocade Web Tools Administrator's Guide - Supporting Fabric OS v7.0.0 (53-1002152-01, March 2012)


Web Tools Adminstrator’s Guide 109
53-1002152-01
Creating basic performance monitor graphs
8
Creating basic performance monitor graphs
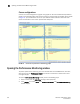
To create the basic performance monitor graphs listed in Table 11 on page 105, perform the
following steps.
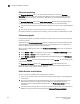
1. Open the Performance Monitoring window.
2. Select Performance Graphs > Basic Monitoring > Graph Type.
Depending on the type of graph you select, you might be prompted to select a slot or port for
which to create a graph.
3. If prompted, drag the port into the Enter/drag slot,port field, or manually enter the slot and
port information in the field, in the format slot,port.
NOTE
For the Brocade 300, 5100, 5300, 6510, VA-40FC, 7800 Extension, 8000, and the Encryption
Switch, enter only a port number.
4. Click OK.
The graph is displayed in a window in the Performance Monitoring window.
Customizing basic monitoring graphs
You can customize some of the basic performance monitoring graphs to display information for
particular ports. For the Brocade 8510-8, Brocade 8510-4, and Brocade DCX and DCX-4S
enterprise-class platforms, you can also customize these graphs to display information for a slot.
You can customize the following graphs:
• Switch Throughput Utilization
• Switch Percent Utilization
• Port Snapshot Error
The following procedure assumes that you already created one of these customizable graphs.
1. Create or access the graph you want to customize.
Refer to “Creating basic performance monitor graphs” on page 109 for instructions on creating
a graph.
2. For Brocade 8510-8, Brocade 8510-4, and Brocade DCX and DCX-4S enterprise-class
platforms, display the detailed port throughput utilization rates for each port in a slot by
clicking the arrows next to a slot. The port information for that slot displays in the graph.
NOTE
For the Brocade 300, 5100, 5300, 6510, VA-40FC, 7800 Extension, 8000, and the Encryption
Switch, proceed to step 3.
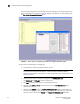
3. To display detailed port throughput utilization rates for particular ports only, right-click
anywhere in the graph and click Select Ports.
The setup dialog box displays, as shown in Figure 22.