
Brocade Web Tools Administrator's Guide - Supporting Fabric OS v7.0.0 (53-1002152-01, March 2012)

50 Web Tools Adminstrator’s Guide
53-1002152-01
Event monitoring
3
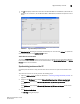
To display Switch Events, perform the following steps.
1. Select the switch from the Fabric Tree.
The Switch View displays.
2. Select the Switch Events tab, if necessary.
Filtering Switch Events
You can filter the fabric and switch events by time, severity, message ID, and service. You can apply
either one type of filter at a time or multiple types of filters at the same time. When a filter is
applied, the filter information displays at the bottom of the filtered information and the Show All link
is available to allow you to view the information unfiltered.
To filter Switch Events, perform the following the procedure.
1. Open the Switch Events tab as described in “Displaying Switch Events” on page 49.
2. Click Filter.
The Event Filter dialog box displays.
3. To filter events within a certain time period:
• Select the From check box and enter the start time and date in the fields.
• Select the To check box and enter the finish time and date in the fields.
• To filter events beginning at a certain date and time, select only the From check box and
enter the start time and date.
• To filter events up until a certain date and time, select only the To check box and enter the
finish time and date.
4. Click OK.
The filter is enabled and the window is refreshed to show the filtered information.
Filtering events by event severity levels
To filter events by event severity levels, perform the following steps.
1. Open the Switch Events tab as described in “Displaying Switch Events” on page 49.
2. Click Filter.
The Event Filter dialog box displays.
3. Select Level.
4. Select the event levels you want to display.
5. Click OK.
The filter is enabled and the window is refreshed to show the filtered information.