
FW V06.XX/HAFM SW V08.02.00 HP StorageWorks Director Element Manager User Guide (AA-RTDUC-TE, July 2004)
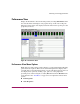

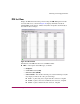
Table Of Contents
- Contents
- About this Guide
- Overview
- Feature Keys
- Managing the Director
- Element Manager Description
- Using the Element Manager
- Backing Up and Restoring Element Manager Data
- Monitoring and managing the Director
- Hardware View
- Port Card View
- Port List View
- Node List View
- Performance View
- FRU List View
- Port Operational States
- Link Incident Alerts
- Threshold Alerts
- Configuring the Director
- Configuring Identification
- Configuring Management Style
- Configuring Operating Parameters
- Configuring a Preferred Path
- Configuring Switch Binding
- Configuring Ports
- Configuring Port Addresses (FICON Management Style)
- Configuring an SNMP Agent
- Configuring Open Systems Management Server
- Configuring FICON Management Server
- Configuring Feature Key
- Configuring Date and Time
- Configuring Threshold Alerts
- Creating New Alerts
- Figure 49: Configure Threshold Alert(s) dialog box
- Figure 50: New Threshold Alerts dialog box - first screen
- Figure 51: New Threshold Alerts dialog box - second screen
- Figure 52: New Threshold Alerts dialog box - third screen
- Figure 53: New Threshold Alerts dialog box - summary screen
- Figure 54: Configure Threshold Alerts dialog box - alert activated
- Modifying Alerts
- Activating or Deactivating Alerts
- Deleting Alerts
- Creating New Alerts
- Configuring Open Trunking
- Exporting the Configuration Report
- Enabling Embedded Web Server
- Enabling Telnet
- Backing Up and Restoring Configuration Data
- Using Logs
- Using Maintenance Features
- Optional Features
- Information and Error Messages
- Index

Monitoring and managing the Director
100 Director Element Manager User Guide
■ Port Technology
■ Block Port
■ Enable Beaconing
■ Port(s) Diagnostics
■ Channel Wrap (FICON management style only)
■ Swap Ports (FICON management style only)
■ Clear Link Incident Alert(s)
■ Reset Port
■ Port Binding
■ Clear Threshold Alert(s)
Note: For Node Properties, if a node is not logged in a message displays indicating
that node information is not available.
Bar Graph Display
The Performance View provides a graphical display of performance for all ports.
Each bar graph in the upper portion of the View panel displays the percentage of
link utilization for the port. This information updates every five seconds. A red
arrow marks the highest utilization since the opening of the Performance View. If
the system detects activity on a port, it represents minimal activity with one bar.
When a port is logged in, moving the mouse pointer over its bar graph displays a
message with the attached port’s WWN. If the port is an E_Port, the message
reads “E_Port.” If the port is not logged in, the message displays the port’s current
operational state. See “Port Operational States” on page 109.