
FW V06.XX/HAFM SW V08.02.00 HP StorageWorks Director Element Manager User Guide (AA-RTDUC-TE, July 2004)
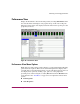


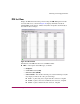

Table Of Contents
- Contents
- About this Guide
- Overview
- Feature Keys
- Managing the Director
- Element Manager Description
- Using the Element Manager
- Backing Up and Restoring Element Manager Data
- Monitoring and managing the Director
- Hardware View
- Port Card View
- Port List View
- Node List View
- Performance View
- FRU List View
- Port Operational States
- Link Incident Alerts
- Threshold Alerts
- Configuring the Director
- Configuring Identification
- Configuring Management Style
- Configuring Operating Parameters
- Configuring a Preferred Path
- Configuring Switch Binding
- Configuring Ports
- Configuring Port Addresses (FICON Management Style)
- Configuring an SNMP Agent
- Configuring Open Systems Management Server
- Configuring FICON Management Server
- Configuring Feature Key
- Configuring Date and Time
- Configuring Threshold Alerts
- Creating New Alerts
- Figure 49: Configure Threshold Alert(s) dialog box
- Figure 50: New Threshold Alerts dialog box - first screen
- Figure 51: New Threshold Alerts dialog box - second screen
- Figure 52: New Threshold Alerts dialog box - third screen
- Figure 53: New Threshold Alerts dialog box - summary screen
- Figure 54: Configure Threshold Alerts dialog box - alert activated
- Modifying Alerts
- Activating or Deactivating Alerts
- Deleting Alerts
- Creating New Alerts
- Configuring Open Trunking
- Exporting the Configuration Report
- Enabling Embedded Web Server
- Enabling Telnet
- Backing Up and Restoring Configuration Data
- Using Logs
- Using Maintenance Features
- Optional Features
- Information and Error Messages
- Index

Monitoring and managing the Director
105Director Element Manager User Guide
Traffic Statistics with Receive and Transmit Values
This section describes the types of traffic statistics that display for a selected port:
■ Link Utilization % Rx and Link Utilization %Tx—There are separate
values for transmit (Tx) and receive (Rx) link utilization. The larger of these
two values displays on the bar graph.
The current link utilization for the port is expressed as a percentage. Each port
can transmit or receive data at 100 Megabytes (MB) per second if the port is
set to 1 Gig. If the port is set to 2 Gig, the port can transmit or receive data at
200 MB per second.This statistic shows the percentage of the maximum link
utilization currently being used. Link utilization is calculated over one-second
intervals. The maximum link utilization is 100%.
■ Frames Rx—The number of frames that the port has received.
■ Frames Tx—The number of frames that the port has transmitted.
■ Four byte words Rx—The number of words that the port has received.
■ Four byte words Tx—The number of words that the port has transmitted.
■ Flows rerouted from ISL—This displays if the optional Open Trunking
feature is installed or not. A value will only display if Open Trunking is
installed, the port is connected to an ISL, and flows were being rerouted. This
is the number of Fibre Channel traffic flows that were rerouted from this ISL
to another ISL due to congestion.
■ Flows rerouted to ISL—This displays if the optional Open Trunking feature
is installed or not. A value will only display if Open Trunking is installed, the
port is connected to an ISL, and flows were being rerouted. This will be the
number of Fibre Channel traffic flows that were rerouted to this ISL from
another ISL due to congestion.
Using Statistics for Troubleshooting
As a general rule, you should clear all counts after the system is stabilized.
When looking at the Performance View, roughly keep track of the time
interval when errors accumulate to judge the presence and severity of a
problem. Also, recognize that there is a link recovery hierarchy implemented
in Fibre Channel to handle some level of expected anomalies. In general, only
be concerned with error counts that increment very quickly.