
FW V06.XX/HAFM SW V08.02.00 HP StorageWorks Director Element Manager User Guide (AA-RTDUC-TE, July 2004)

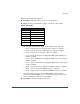


Table Of Contents
- Contents
- About this Guide
- Overview
- Feature Keys
- Managing the Director
- Element Manager Description
- Using the Element Manager
- Backing Up and Restoring Element Manager Data
- Monitoring and managing the Director
- Hardware View
- Port Card View
- Port List View
- Node List View
- Performance View
- FRU List View
- Port Operational States
- Link Incident Alerts
- Threshold Alerts
- Configuring the Director
- Configuring Identification
- Configuring Management Style
- Configuring Operating Parameters
- Configuring a Preferred Path
- Configuring Switch Binding
- Configuring Ports
- Configuring Port Addresses (FICON Management Style)
- Configuring an SNMP Agent
- Configuring Open Systems Management Server
- Configuring FICON Management Server
- Configuring Feature Key
- Configuring Date and Time
- Configuring Threshold Alerts
- Creating New Alerts
- Figure 49: Configure Threshold Alert(s) dialog box
- Figure 50: New Threshold Alerts dialog box - first screen
- Figure 51: New Threshold Alerts dialog box - second screen
- Figure 52: New Threshold Alerts dialog box - third screen
- Figure 53: New Threshold Alerts dialog box - summary screen
- Figure 54: Configure Threshold Alerts dialog box - alert activated
- Modifying Alerts
- Activating or Deactivating Alerts
- Deleting Alerts
- Creating New Alerts
- Configuring Open Trunking
- Exporting the Configuration Report
- Enabling Embedded Web Server
- Enabling Telnet
- Backing Up and Restoring Configuration Data
- Using Logs
- Using Maintenance Features
- Optional Features
- Information and Error Messages
- Index
Using Logs
177Director Element Manager User Guide
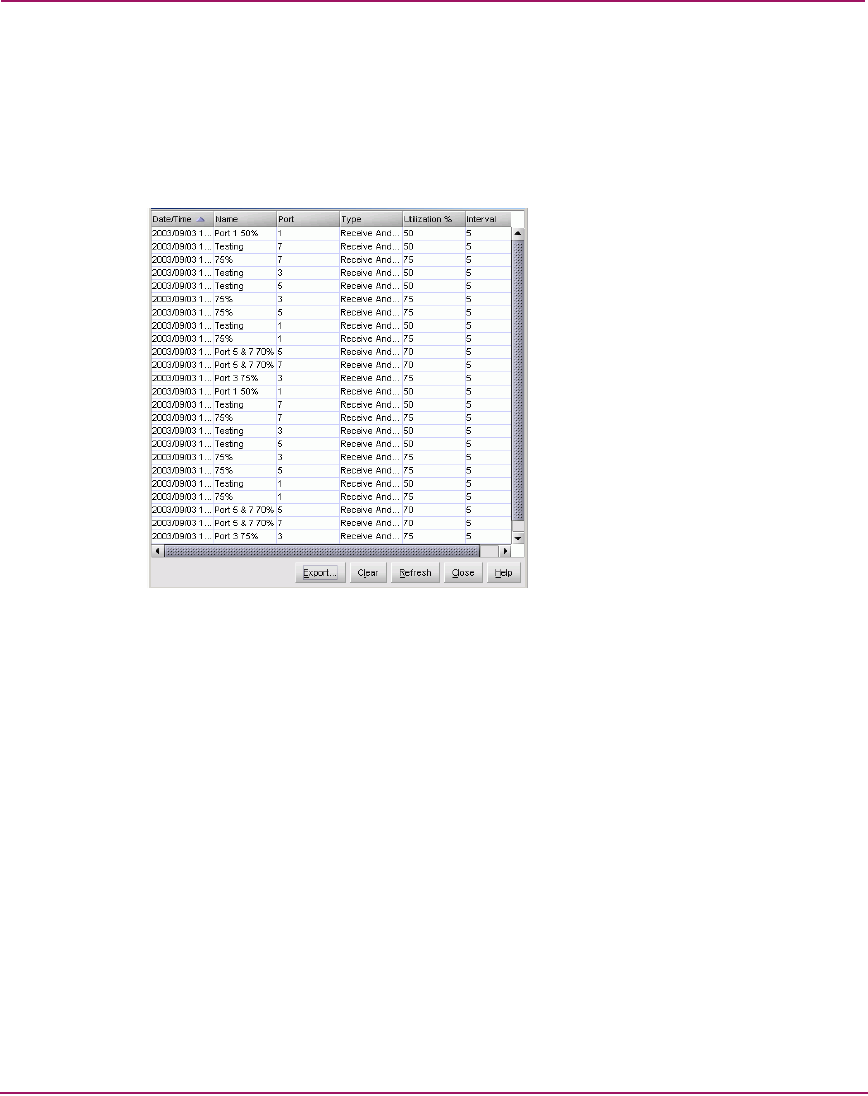
Threshold Alert Log
This log provides details of threshold alert notifications. Besides the date and time
that the alert occurred, the log also displays details about the alert as configured
through the Configure Threshold Alerts option under the Configure menu on
the menu bar.
Figure 61: Threshold Alert Log
■ Date/Time—Date and time stamp for when the alert occurred.
■ Name—Name for the alert as configured through the Configure Threshold
Alerts dialog box.
■ Port—Port number where the alert occurred.
■ Type—The type of alert: transmit (Tx) or receive (Rx).
■ Utilization %—Percent usage of traffic capacity. This is the percent of the
port’s throughput capacity achieved by the measured throughput. This setting
constitutes the threshold value and is configured through the Configure
Threshold Alerts dialog box. For example, a value of 25 means that threshold
occurs when throughput reaches 25 percent of the port’s capacity.
■ Alert Time—The time that the utilization % must exist before an alert is
generated. This is set through the Configure Threshold Alerts dialog box.
■ Interval—The time interval during which the throughput is measured and an
alert can generate. This is set through the Configure Threshold Alerts dialog
box.