
DCFM Enterprise User Manual (53-1001775-01, June 2010)


DCFM Enterprise User Manual 295
53-1001775-01
Filtering real-time performance data
11
Filtering real-time performance data
To filter real-time performance data from the Real Time Performance Graphs dialog box, complete
the following steps.
1. Open the Real Time Performance Graphs dialog box.
For step-by-step instructions, refer to “Generating a real-time performance graph” on
page 294. The Real Time Performance Graphs dialog box displays.
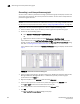
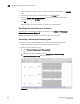
FIGURE 108 Real Time Performance Graphs dialog box
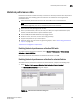
2. Click Select to change the object type.
3. Select the object type (FC Ports, ISL Ports, Device Ports, EE Monitors, GE Ports, FCIP Tunnels,
Managed HBA Ports, Managed CNA Ports, or 10GE Ports) by which you want to graph
performance from the Show list.
4. Right-click anywhere in the Available table and select Expand All.
5. Select the ports you want to include in the performance graph in the Available table.
Press Ctrl or Shift and then click to select more than one port.
6. Click the right arrow to move the selected ports to the Selected table.
7. Clic k OK.
The Real Time Performance Graphs dialog box displays.
8. Select the measure by which you want to gather performance data from the Measures list.
To select more than one measure, click the Additional Measures expand arrows and select the
check box for each additional measure.
9. (Optional) Enter a value (percentage) in the Reference Line field to set a reference for the
transmit and receive utilization.
Note that this field is only available when you select Tx % Utilization or Rx % Utilization from the
Measures list.