
DCFM Enterprise User Manual (53-1001775-01, June 2010)


DCFM Enterprise User Manual 409
53-1001775-01
Displaying FCIP performance graphs
16
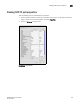
Displaying FCIP performance graphs
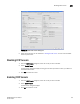
You can display performance graphs by clicking the Performance button on the FCIP Tunnels dialog
box. You can also display performance graphs from Properties, as described in the following
sections.
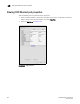
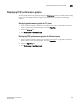
Displaying performance graphs for FC ports
1. Select an extension blade or switch from the Fabric Tree structure, or right-click an extension
blade or switch on the Connectivity Map, and select Properties.
2. Select the FC Ports tab.
3. Click Performance > Real Time Graph.
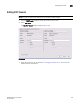
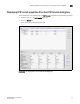
Displaying FCIP performance graphs for Ethernet ports
1. Select an extension blade or switch from the Fabric Tree structure, or right-click an extension
blade or switch on the Connectivity Map, and select Properties.
2. Select the GigE Ports tab.
3. Click Performance > Real Time Graph.