
DCFM Enterprise User Manual (53-1001775-01, June 2010)


52 DCFM Enterprise User Manual
53-1001775-01
Fabric monitoring
2
Fabric monitoring
NOTE
Monitoring is not supported on Hosts. The upper limit to the number of HBA and CNA ports that can
be monitored at the same time is 32. The same upper limit applies if switch ports and HBA ports are
combined. You can select switch ports and adapter ports from a maximum of ten devices.
Fabric monitoring enables discovery of and data collection for the specified fabric and all
associated devices. The Management application enables you to view fabric monitoring status
through the Discover Setup dialog box. The following table illustrates and describes the icons that
indicate the current status of the discovered fabrics.
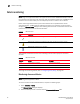
Table 6 details the default and minimum monitoring intervals used to query the monitored
switches:
To change the monitoring interval, refer to “Configuring asset polling” on page 99.
Monitoring discovered fabrics
NOTE
Monitoring is not supported on Hosts.
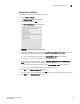
To monitor a fabric and all associated devices, complete the following steps.
1. Select Discovery > Setup.
The Discover Setup dialog box displays.
2. Select the fabric you want to monitor from the Discovered Addresses table.
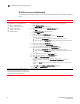
TABLE 5 Monitor Icons
Icon Description
Displays when the fabric is managed and the switch management status is okay.
Displays when the fabric is managed and the switch management status is not okay.
Displays when the fabric is not managed.
TABLE 6 Monitor Intervals
SAN Size Default Minimum
Small 120 seconds (2 minutes) 60 seconds (1 minute)
Medium 900 seconds (15 minutes) 120 seconds (2 minutes)
Large 1800 seconds (30 minutes) 180 seconds (3 minutes)