
DCFM Professional Plus User Manual (53-1001774-01, June 2010)


300 DCFM Professional Plus User Manual
53-1001774-01
11
The Source and Destination icons and the Graph column do not display
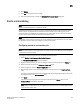
12. Save this configuration by selecting Save.
The Save Favorites dialog box displays. This enables you to save the selected configuration so
that you can use it to generate the same type of report at a later date.
13. Enter a name for the configuration in the Favorites Name field.
14. Click OK.
15. Click Apply.
The selected graph automatically displays in the Historical Performance Graph dialog box.
16. Click the close button (X) to close the HIstorical Performance Graph dialog box.
Exporting historical performance data
To export historical performance data, complete the following steps.
1. Generate a performance graph.
To generate a performance graph, refer to “Generating a historical performance graph” on
page 298.
2. Right-click anywhere in the graph table and select Export Table.
The Save table to a tab delimited file dialog box displays.
3. Browse to the file location where you want to save the performance data.
4. Enter a name for the file and click Save.
Deleting a historical performance graph
To delete a user-defined historical performance graph configuration, complete the following steps.
1. Select the device for which you want to generate a performance graph.
2. Choose one of the following options:
• Select Monitor > Performance > Historical Graph.
OR
• Right-click the device or fabric and select Performance > Historical Graph.
The Historical Performance Graph dialog box displays.
3. Select the configuration you want to delete from the Favorites list.
You can only delete a user-defined historical performance graph. You cannot delete a default
favorite historical performance graph.