
DCFM Professional Plus User Manual (53-1001774-01, June 2010)


302 DCFM Professional Plus User Manual
53-1001774-01
11
Once you have created the end-to-end monitored pair, you can view both real-time and
historical performance data. For step-by-step instructions refer to “Displaying end-to-end
monitor pairs in a real-time graph” on page 302 or “Displaying end-to-end monitor pairs in a
historical graph” on page 302.
Displaying end-to-end monitor pairs in a real-time graph
To display an end-to-end monitor pair in a graph, complete the following steps.
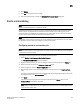
1. Select Monitor > Performance > End-to-End Monitors.
The Set End-to-End Monitor dialog box displays.
2. Select one or more end-to-end monitor pairs you want to view from the Monitored Pairs table.
You can select up to 32 monitored pairs.
3. Click Real-Time Graph.
The Real Time Performance Graphs dialog box displays.
Displaying end-to-end monitor pairs in a historical graph
To display monitored pairs in a historical graph, data collection must be enabled for the selected
fabric or enabled SAN wide.
To display an end-to-end monitor pair in a graph, complete the following steps.
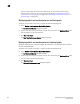
1. Select Monitor > Performance > End-to-End Monitors.
The Set End-to-End Monitor dialog box displays.
2. Select one or more end-to-end monitor pairs you want to view from the Monitored Pairs table.
You can select up to 100 monitored pairs.
3. Click Historical Graph.
The Historical Performance Graph dialog box displays.