
edge switch 2/32 product manager user guide


1–30 edge switch 2/32 product manager user guide
Product Manager Overview
Performance View
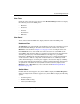
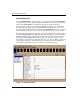
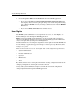
Choose the Performance view tab. Figure 1–9 shows an example of the Performance
view. This view provides a graphical display of performance for all 32 ports. The top
portion of the Performance view displays bar graphs that show the level of
transmit/receive activity for each port. This information updates every five seconds.
Each bar graph also shows the percentage link utilization for the port. A red arrow
marks the highest utilization level reached since the Performance view was opened. If
the system detects activity on a port, it shows minimal activity with at least one bar.
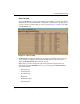
When an end device (node) is logged into a port, moving the cursor over the port’s bar
graph in the Performance view highlights the graph and displays a message with the
World Wide Name of the connected node. If the connected node has more than one
port, this is the World Wide Name of the specific port on the node. When a port is
functioning as an expansion port (E_Port), the message is “E_Port.” When a port is not
logged into an end-device (not functioning as an F_Port) or to another Switch (not
functioning as an E_Port), the message is the port’s current online state.
Figure 1–9: Performance View