
edge switch 2/32 product manager user guide


edge switch 2/32 product manager user guide 1–31
Product Manager Overview
Right-click a bar graph to display a menu of port-related actions. The options available
on this menu are the same as those that are available when you right-click a port in the
Hardware view or right-click a row in the Port List view. These include:
• Port Properties
• Node Properties
• Port Technology
• Block Port
• Enable Beaconing
• Port Diagnostics
• Channel Wrap (S/390 mode only)
• Swap Ports (S/390 mode only)
• Clear Link Incident Alert(s)
• Reset Port
• Port Binding
• Clear Threshold Alert(s)
Note that these same options are also available when you click a port’s graph, then
choose the Port secondary menu from the Product menu on the menu bar.
For details on menu options, refer to Port Menu on page 2-16.
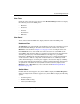
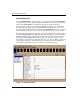
The bottom portion of the Performance view displays cumulative statistical
information for the port selected in the bar graph. Values are displayed for transmit
and receive traffic, class 2 and 3 statistics, operational statistics, and error categories.
Click a category in the left frame of the statistics area to display only statistics in that
category or click All to display values for all categories.Click the Refresh button to
update the data with current data from the port.
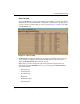
Click the Clear button to clear all of the counters to zero. Choosing this button
displays a Clear Port Statistics dialog box. Choose the appropriate radio button and
click OK to clear all counters to zero on the selected port only or counters on all ports
on the Director.
NOTE: Clearing the counters clears the statistics for all users.
For more information about the Performance view, including statistics descriptions,
refer to Performance View on page 2-30.