
edge switch 2/32 product manager user guide

2–30 edge switch 2/32 product manager user guide
Monitoring and Managing the Switch
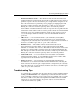
Performance View
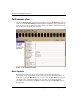
Display the Performance view in the view panel by choosing Performance from the
view tabs in the Product Manager window. This view displays a bar graph at the top
of the view for each port. The lower portion of the view displays statistical values for
the specific port’s bar graph that you select.
Figure 2–15: Performance view
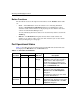
Menu Options
Right-click any of the port bar graphs to display a menu with the following
port-related action options. These are the same menu options that display when you
right-click a port in the Hardware view or a port row in the Port List view. You can
also display these options by clicking a port, port row, or port bar graph in the
preceding views and choosing the Port secondary menu from the Product menu on
the menu bar.