
FW 08.01.00 McDATA® Sphereon 3032 and 3232 Fabric Switches Installation and Service Manual (620-000155-220, November 2005)
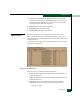
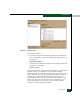
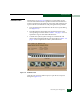
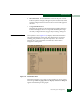
Table Of Contents
- Preface
- General Information
- Installation Tasks
- Factory Defaults
- Installation Options
- Summary of Installation Tasks
- Task 1: Verify Installation Requirements
- Task 2: Unpack, Inspect, and Install the Ethernet Hub (Optional)
- Task 3: Unpack, Inspect, and Install the Switch
- Task 4: Configure Network Information
- Task 5: LAN-Connect the Switch
- Task 6: Unpack, Inspect, and Install the Management Server
- Task 7: Configure Management Server Password and Network Addresses
- Task 8: Configure Management Server Information
- Task 9: Configure Windows 2000 Users
- Task 10: Set Management Server Date and Time
- Task 11: Configure the Call-Home Feature (Optional)
- Task 12: Assign User Names and Passwords
- Task 13: Configure the Switch to the Management Application
- Task 14: Record or Verify Management Server Restore Information
- Task 15: Verify Switch-to-Management Server Communication
- Task 16: Configure PFE Key (Optional)
- Task 17: Configure Management Server (Optional)
- Flexport
- Open Trunking
- Task 18: Set Switch Date and Time
- Task 19: Configure the Sphereon 3032/3232 Element Manager Applications
- Task 20: Configure Switch Operating Parameters
- Task 21: Configure Fabric Operating Parameters
- Fabric Parameters
- Configure Ports (Open Systems Mode)
- Configure Ports (FICON Mode)
- Configure Port Addresses (FICON Mode)
- Configure SNMP Trap Message Recipients
- Configure and Enable E-mail Notification
- Configure and Enable Ethernet Events
- Configure and Enable Call-Home Event Notification
- Configure Threshold Alerts
- Procedures
- Task 22: Configure Open Trunking
- Task 23: Test Remote Notification (Optional)
- Task 24: Back Up Configuration Data
- Task 25: Configure the Switch from the EFCM Basic Interface (Optional)
- Configure Product Identification
- Configure Date and Time
- Configure Parameters
- Configure Fabric Parameters
- Configure Network Information
- Configure Basic Port Information
- Configure Port BB_Credit
- Configure Port NPIV
- Configure SNMP
- Enable CLI
- Enable or Disable Host Control
- Configure SSL Encryption
- Install PFE Keys (Optional)
- Configure Security
- Configure Interswitch Links
- Task 5: Configure Product Network Information (Optional)
- Task 26: Cable Fibre Channel Ports
- Task 27: Connect Switch to a Fabric Director (Optional)
- Task 28: Register with the McDATA File Center
- Diagnostics
- Maintenance Analysis Procedures
- MAP 0000: Start MAP
- MAP 0100: Power Distribution Analysis
- MAP 0200: POST, Reset, or IPL Failure Analysis
- MAP 0300: Console Application Problem Determination
- MAP 0400: Loss of Console Communication
- MAP 0500: Fan and CTP Card Failure Analysis
- MAP 0600: Port Failure and Link Incident Analysis
- MAP 0700: Fabric, ISL, and Segmented Port Problem Determination
- MAP 0800: Server Hardware Problem Determination
- Repair Information
- Factory Defaults
- Procedural Notes
- Using Log Information
- Using Views
- FRU List View
- Performing Port Diagnostics
- Swapping Ports
- Collecting Maintenance Data
- Clean Fiber-Optic Components
- Power-On Procedure
- Power-Off Procedure
- Reset or IPL the Switch
- Set the Switch Online or Offline
- Block and Unblock Ports
- Manage Firmware Versions
- Manage Configuration Data
- Install or Upgrade Software
- FRU Removal and Replacement
- Illustrated Parts Breakdown
- Messages
- Event Code Tables
- Restore EFC Server
- Consolidating EFC Servers in a Multiswitch Fabric
- Glossary
- Index

4
4-22
McDATA® Sphereon 3032 and 3232 Fabric Switches Installation and Service Manual
Repair Information
For a description of how to expand or collapse the active zone set list
and an explanation of button functions at the bottom of the Zoning
View, refer to the McDATA Enterprise Fabric Connectivity Manager User
Manual (620-005001).
Performing Port Diagnostics
Port diagnostics are performed at the switch and Sphereon 3032/3232
Product Manager application. These diagnostics include:
• Inspecting port light-emitting diodes (LEDs) at the switch.
• Obtaining port degradation or failure information at the Product
Manager application’s Hardware View.
• Obtaining statistical performance information for ports at the
Product Manager application’s Performance View.
• Performing internal or external port loopback tests.
• Performing channel wrap tests. The tests apply only to a switch
configured for FICON management style.
Port LEDs
To obtain port operational information at the switch, inspect the port
LEDs. Amber and green LEDs adjacent to each port indicate
operational status as follows:
— The green LED illuminates (or blinks if there is active traffic)
and the amber LED extinguishes to indicate normal port
operation.
— The amber LED illuminates and the green LED extinguishes to
indicate a port failure.
— Both LEDs extinguish to indicate a port is operational but not
communicating (no SFP installed, no cable attached, loss of
light, port blocked, or link recovery in process).
— The amber LED flashes and the green LED illuminates (or
blinks if there is active traffic) to indicate a beaconing is set for
the port.
— The amber LED flashes and the green LED extinguishes to
indicate a port is running online diagnostics, or beaconing is
set and the port is not communicating (no SFP installed, no
cable attached, loss of light, port blocked, or link recovery in
process).