
HP StorageWorks Enterprise File Services WAN Accelerator 3.0.4 Command-Line Interface reference manual (AG421-96004, March 2007)


64 3 - ENABLE-MODE COMMANDS
Parameters
Example
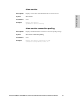
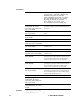
minna # show stats alarm
Alarm admission_conn: ok
alarm <type> Displays alarm statistics. Specify alarm type or
<carriage return>: <alarm-ID>, admission-conn,
admission_mem, bypass, cpu_util_indiv,
critical_temp, duplex, fs_mnt, halt_error, license,
link_state, mismatch_peer, nfs_v2_v4, paging,
pfs_config, pfs_disk_full, pfs_operation,
power_supply, rcu_error, service_error,
store_corruption, sw-version, warning_temp.
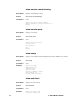
bandwidth {all | <port>
bi-directional | lan-to-wan |
wan-to-lan} {1min | 5min | hour |
day | week | month}
Displays bandwidth statistics for the specified period.
The all option displays aggregate bandwidth statistics
for all ports.
conn-pool {1min | 5min | hour |
day | week | month}
Displays connection pooling statistics for the specified
period.
connections {5min | hour | day |
week | month}
Displays connection statistics for the specified period.
cpu Displays Central Processing Unit (CPU) statistics.
datastore <carriage return> |
[5min | hour | day | week | month]
Displays data store statistics for the specified period.
link-state {all} {loss-rate {hour |
day | week | month}}
Displays link-state statistics on packet loss rate for the
specified period.
memory Displays memory statistics.
neighbor-fwd {all | default {pkt |
byte {hour | day | week | month}}}
Displays connection forwarding statistics for the
specified period.
nfs {all 1min |
5min | hour | day |
week | month}
Displays NFS statistics for the specified period. The all
option displays aggregate statistics for all NFS servers.
You can substitute a server name for all to display
statistics for the specified server you configured.
pfs {all 1min |
5min | hour | day |
week | month}
Displays PFS statistics for the specified period. The all
option displays aggregate statistics for all PFS shares.
You can substitute a share name for all to display
statistics for the specified share you configured.
qos {all | default {pkt | byte {hour |
day | week | month}}}
Displays QoS statistics for the specified period. The all
option displays aggregate statistics for all QoS classes.
You can substitute a QoS class name for all to display
statistics for the specified QoS class.
settings bandwidth ports Displays ports being monitored.
throughput {all | <port>
bi-directional | lan-to-wan |
wan-to-lan} {1min | 5min | hour |
day | week | month}
Displays throughput statistics for the specified period.
traffic {passthrough | optimized}
{1min | 5min | hour | day | week |
month}
Displays traffic statistics for the specified period.