
Web Tools User's Guide (Version 3.0)


Web Tools User’s Guide 4-23
Switch View
4
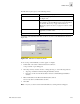
The Edit Canvas option gives you the following choices:
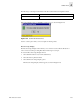
An example of the data entry frame that you will see if you choose the Edit Canvas is shown in
Figure 4-22:
Figure 4-22 Edit Canvas Data Entry Frame
To choose the port and LUN that you want to graph or configure:
1. Double-click on the folder in the Port Selection List window.
A drop down list of ports will appear.
2. Select the port that you want to monitor or change by using one of the following methods:
• Type the port number in the Enter /Drag Port Numbers window.
• Drag the port “file” from the Port Selection window to the Enter/Drag Port Number
window.
3. Enter a LUN number in the Enter Lun Number (Hex) window.
You can only enter four LUN numbers at a time.
4. Select OK.
Note: If you try to enter more than four LUN numbers, a warning window will appear.
Save Select to save an edited graph.
Edit Select to alter a graph. For more information on this button,
see Figure 4-22.
Add Select to add a graph to a canvas. You will be prompted to
choose Basic or Advanced Monitoring. For more information,
see the Basic Monitoring on page 4-27 and Advanced
Monitoring (Optional Software) on page 4-31 sections of this
chapter.
Remove Select to delete a graph. You will be prompted to choose the
graph that you want to delete.
Cancel Select to exit the window without making any changes.