
HP StorageWorks P9000 Performance Advisor Software v5.3 User and Troubleshooting Guide (T1789-96322, August 2011)
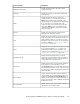
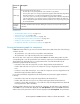


DescriptionScreen ele-
ments
This list displays the following options:
• All: This option is for viewing both the serious and the recovery alarms.
• Recovery: This option is for viewing records that are logged for alarm notifications dispatched
after the performance of a component dropped below the set threshold limit.
• Serious: This option is for viewing records that are logged for alarm notifications dispatched
when the performance of a component rises beyond the set threshold limit. An alarm noti-
fication is dispatched only the first time when the performance of a component goes beyond
the set threshold limits.
Alarm Type
Select the start and end time range for filtering the component records, from the respective
calendars.
Start Time,
End Time
boxes
Related Topics
• “Understanding alarms history” on page 159
• “Alarm History screen” on page 160
• “Filtering records in Alarms History table” on page 162
• “Viewing graph of metric value's performance” on page 165
• “Adding or removing metric values” on page 144
• “Configuring notification and monitoring settings” on page 146
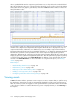
Viewing performance graphs for components
P9000 Performance Advisor logs a new record in the Alarms History table when either of the following
conditions are met:
• The performance of a component rises beyond the set threshold limit.
• The performance of a component drops below the set threshold limit.
The current value of the component is displayed under Value in the Alarms History table. Click the
corresponding link to view the performance value when the component crossed the threshold level or
dropped below the threshold level. For a component that has crossed the threshold limit, the
performance graph includes the following:
• Performance value when the component crossed or dropped below the threshold level.
• Includes data collected 1 hour prior to the component crossing or dropping below the threshold
level.
• Continues to show data collected upto 1 hour after the component crossed or dropped below the
threshold level (if performance data is available).
For a component that has dropped below the threshold limit, the performance graph includes the
following:
• Performance value when the component dropped below the threshold level.
• Includes data collected 1 hour prior to the component dropping below the threshold level.
• Continues to show data collected up to 1 hour after the component dropped below the threshold
level (if performance data is available).
The data available displays the progress trend of the component. The performance value displayed
under Value is in sync with the time displayed under Time Updated. It implies that P9000 Performance
Advisor retrieves the performance value for the time displayed under Time Updated. The performance
HP StorageWorks P9000 Performance Advisor Software User Guide 165