
HP StorageWorks P9000 Performance Advisor Software v5.3 User and Troubleshooting Guide (T1789-96322, August 2011)


IMPORTANT:
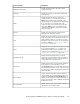
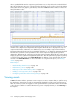
By default, the Event Log screen displays records for events that have been generated in the last 24
hours.
Event Log table, where all the events generated are displayed.1
The records logged contain the following details for an event:
• Time when the event was logged.
• Type of event logged.
• Severity of the event.
• Description.
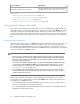
In addition, view the following details on the Event Log screen:
• Historic data (data older than 24 hours) by specifying a date range for viewing the data.
• Filter the event records based on severity and type of events generated.
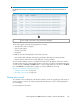
Click a column heading to sort the records based on that column. By default, columns are sorted in
ascending order. Click the column heading again to reverse the sort order. To navigate through pages
of event records, use Previous and Next buttons, or enter a page number of your choice in the Go To
box. Click Refresh to reload the Event Log page to view the updated set of records.
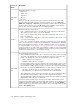
Tasks you can perform on the Event Log screen
• “Filtering event records” on page 167
• “Deleting event records” on page 169
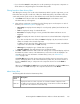
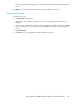
Filtering event records
You can filter event records based on the duration when the events are logged, type, and severity of
events logged. You can also do a quick text based search that works only on records displayed in
the current page.
For search based on text entries:
HP StorageWorks P9000 Performance Advisor Software User Guide 167