
HP StorageWorks P9000 Performance Advisor Software v5.3 User and Troubleshooting Guide (T1789-96322, August 2011)
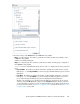
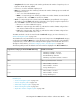

The related metrics associated with the resources types and components in the THP Pool category are
displayed in the Choose Metrics box. Select the metrics at the component type or the individual
component levels, or both and view the related performance graphs in the Chart Work Area. For a
description of these metrics, see “Metric Category, metrics, and descriptions” on page 441.
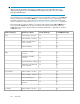
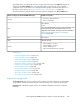
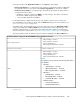
The following table provides the default set of metrics that are displayed in the Choose Metrics box.
Default set of metricsTHP Pool category for XP and P9000 disk arrays
• Frontend Vs. Backend Hit Ratio
• THP Pool Total MB/s
THP Pool
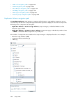
ACP Utilization
NOTE:
Since, the ACP/DKA MPs are moved to the MP blades in the
P9000 disk arrays, their MP utilization metrics are not
applicable for the P9000 disk arrays. For more information,
see “Viewing MP blade utilization for P9000 disk
arrays” on page 224.
DKA
RG UtilizationRG(s)
LDEV RG UtilizationLDEVs
• LDEV Total IO/s – Frontend
• LDEV Total MB/s – Frontend
• Average Read Response
• LDEV Sequential Read Tracks – Backend
Volumes
Related Topics
• “Front-end navigation path” on page 272
• “Cache navigation path” on page 275
• “MP Blades navigation path” on page 277
• “Back-end navigation path” on page 278
• “Replication Volumes navigation path” on page 288
• “Snapshot Pool navigation path” on page 285
• “LUSE navigation path” on page 290
• “Host Groups navigation path” on page 292
• “Ext-RG(s) navigation path” on page 294
• “Drive types navigation path” on page 296
• “Custom groups navigation path” on page 298
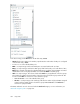
Snapshot Pool navigation path
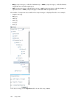
The Snapshot Pool main category comprises of the snapshot pools that contain the associated RAID
groups, LDEVs, and the associated host group's VVols. Following is the component selection path:
Snapshot Pool > Individual snapshot pool IDs. Each individual Snapshot pool further includes the
following:
HP StorageWorks P9000 Performance Advisor Software User Guide 285