
HP StorageWorks P9000 Performance Advisor Software v5.3 User and Troubleshooting Guide (T1789-96322, August 2011)
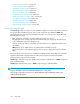
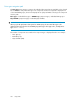
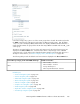

In the above image, CG_1_CG is one of the custom groups that is selected. The number (5) besides
the LDEVs component type indicates the total number of LDEVs grouped in CG_1_CG. The LDEVs
1:7A, 1:7C, and 1:7B display 30064 and the LDEV 9:67 displays 82502 beside their LDEV IDs. It
implies that these LDEVs are grouped from the XP disk arrays 30064 or 82502 under the CG_1_CG
custom group.
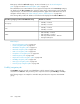
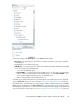
The metrics associated with the resources types and components for the selected custom group are
displayed in the Choose Metrics box. Select the metrics at the component type or the individual
component levels, or both and view the related performance graphs in the Chart Work Area. For a
description of these metrics, see “Metric Category, metrics, and descriptions” on page 441.
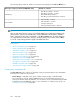
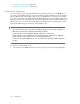
The following table provides the default set of metrics that are displayed in the Choose Metrics box.
Default set of metricsCustom Groups category for XP and P9000 disk arrays
• LDEV Total IO/s – Frontend
• LDEV Total MB/s – Frontend
• Average Read Response
• LDEV Sequential Read Tracks – Backend
LDEVs
Related Topics
• “Front-end navigation path” on page 272
• “Cache navigation path” on page 275
• “MP Blades navigation path” on page 277
• “Back-end navigation path” on page 278
• “THP Pool navigation path” on page 283
• “Snapshot Pool navigation path” on page 285
• “LUSE navigation path” on page 290
• “Replication Volumes navigation path” on page 288
• “Host Groups navigation path” on page 292
HP StorageWorks P9000 Performance Advisor Software User Guide 299