
HP StorageWorks P9000 Performance Advisor Software v5.4 User Guide (T1789-96328, April 2012)
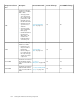

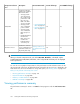

For P9000 disk arraysFor XP disk arraysDocumentation LinksDescriptionComponent selection
tree
YesNo
• “Viewing CHIP/CHA
data” on page 205
• “Viewing ACP/DKA
data” on page 210
Provides the following
details for the installed
CHA and the DKA:
• Average perform-
ance derived from
the overall average
performance of all
the ports in the
CHIP or the RAID
groups in the DKA
• Average perform-
ance of individual
ports for a CHA
• Average perform-
ance of individual
RAID groups for a
DKA
• Combined backend
transfer for the
DKA, which is de-
rived from the
backend transfers
on the ThP pools.
CHA/DKA
YesNo
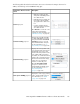
Viewing continuous ac-
cess data for P9000 disk
arrays
Provides the continuous
access configuration and
performance metrics for
the primary disk array.
Continuous Access
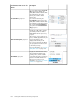
IMPORTANT:
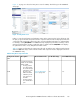
When you select the component nodes, such as the ACP, CHIP, MP Blades, or the Pools, only the
installed ACPs/DKAs, CHIPs/CHAs, MP blades, or the configured ThP and smart pools are displayed
in the respective lists.
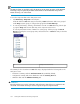
You can also view a graphical representation of the performance and the utilization metrics for the
above-mentioned components. By default, the data collected for the last one hour is displayed in the
Chart Work Area. For more information on using chart options, see “Plotting charts” on page 262.
Tasks you can perform on the Array View screen
• “Viewing performance summary” on page 196
• “Volume Information” on page 202
• “Advisory on CLPR utilization” on page 205
• “Utilization Summary” on page 203
Viewing performance summary
The performance summary for an XP or a P9000 disk array appears under the Performance View
tab.
Viewing XP and P9000 disk array components196