
HP StorageWorks P9000 Performance Advisor Software v5.4 User Guide (T1789-96328, April 2012)


10 Using charts
This chapter discusses the following topics:
• “Introduction” on page 257
• “Plotting charts” on page 262
Introduction
You can plot performance graphs to view historical data of components that belong to the same or
different XP disk arrays and P9000 disk arrays. Graphical representation of components performance
metrics is especially useful when you want to compare similar components of different XP and P9000
disk arrays to determine their performance and observe trends. You can plot performance graphs of
components for different metrics that belong to the following metric categories:
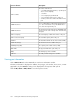
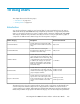
Unit of measurementDescriptionMetric category
IO/second
Provides metrics for measuring the I/Os
from a host to the XP and the P9000 disk
arrays
Frontend IO Metrics
MB/second
Provides metrics for measuring the
throughput of the I/Os from a host to the
XP and the P9000 disk arrays
Frontend MB Metrics
% utilization
Provides metrics for measuring the CPU
cycles of the processors that reside on the
CHAs and DKAs in the XP disk arrays, and
on the MP blades in the P9000 disk arrays.
In addition, this category also provides
metrics for measuring the cache and the
RAID groups utilization in the XP and the
P9000 disk arrays.
Utilization Metrics
Number of reads
Number of writes
Provides metrics for measuring the number
of reads and writes on the disks in the XP
and the P9000 disk arrays, applies to RAID
groups and physical LDEVs.
Backend Metrics
Read response time
Write response time
Provides metrics for measuring the read
response time or the write response time
for the read I/O requests or the write I/O
requests on the XP and the P9000 disk
arrays.
Response Time Metrics
The metrics that you select are component driven, where specific set of metrics are displayed for the
selected components. Related components are categorized to be available for selection under a
common category. For example, all the DKA pairs and their MPs, RAID groups and associated physical
LDEVs and pool LDEVs are grouped in the Back-end category. You can also analyze the performance
HP StorageWorks P9000 Performance Advisor Software User Guide 257