
HP StorageWorks P9000 Performance Advisor Software v5.4 User Guide (T1789-96328, April 2012)

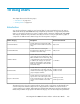

DescriptionSections
Includes the Available Metrics Choose Metric Category list that
displays all the applicable metrics from the following metric
categories for a selected component:
• Frontend IO Metrics
• Frontend MB Metrics
• Utilization Metrics
• Backend Metrics
• Response Time Metrics
Select components from the component selection tree and metrics
from the Available Metrics Choose Metric Category list to view their
performance graphs in the Chart Work Area. By default, the most
used metric category and related category metrics are listed. For
more information, see “Choosing metrics” on page 268.
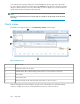
The Chart Settings section displays settings that you can apply on
the selected charts. You can do the following using the chart
settings:
• View performance graphs of components for a duration of your
choice.
• Forecast the DKA, MP, cache write pending, RAID group, and
ThP pool utilization for an XP disk array.
Forecast the MP blade, cache write pending, RAID group, and
ThP pool utilization for a P9000 disk array.
• View the last 10 performance data points for components.
• View graphs using the different chart styles.
• View or hide the legends, zoom preview panel, and the data
points.
• View the LDEVs that are currently assigned to MP blades.
• Align the chart windows either vertically or horizontally in the
Chart Work Area.
For more information, see “Using chart controls and
settings” on page 304.
Chart Settings
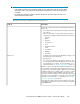
The Chart Work Area consists of the following:
• The individual chart windows that display the performance
graphs of components for the selected metrics.
• The chart controls that can be used to perform various tasks on
the individual chart windows.
• The zoom preview panel, where you can preview performance
of components for a specified duration.
For more information, see “Viewing charts” on page 296.
Chart Work Area
Using charts260