
HP StorageWorks P9000 Performance Advisor Software v5.4 User Guide (T1789-96328, April 2012)

By default, the metrics for the first metric category in the list are automatically displayed in the
Metric column.
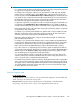
3. Choose the metrics for which you want to view the performance of the selected components. For
more information, see “Choosing metrics” on page 268. By default, the most used metric category
and related category metrics are listed.
A performance graph for the selected component and metric is automatically displayed in the
Chart Work Area.
• If the selected metric belongs to the same metric category for which you already have selected
a default metric and plotted a performance graph, the new graph is also plotted in the same
chart window.
• If the selected metric belongs to a different metric category, the new graph appears in a new
chart window.
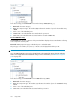
4. After the performance graphs are displayed, use the Chart controls and settings to perform the
intended tasks that include previewing the performance graphs for a duration that you select,
zooming on data points in the chart window, and rearranging charts in the Chart Work Area.
For more information, see “Using chart controls and settings” on page 304.
Related Topics
• “Selecting components and metrics” on page 265
• “Viewing charts” on page 296
• “Using chart controls and settings” on page 304
Selecting components and metrics
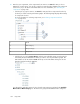
The component selection tree provides a hierarchal representation of components under the following
main nodes:
• The XP and the P9000 disk arrays monitored by P9000 Performance Advisor. Click the plus (+)
sign for an individual XP or a P9000 disk array node to view the corresponding main categories
in the component selection tree (see the following table). If an XP or a P9000 disk array supports
a particular component type and it is not configured on that XP or P9000 disk array, the main
category is still displayed in the component selection tree. However, the associated metrics are
not displayed for selection and the Available Metrics Choose Metric category list is also disabled.
• Custom Groups, that displays the individual custom groups. Click an individual custom group to
view all the associated LDEVs grouped in the LDEV component type. For more information on
creating custom groups, see “Creating custom groups” on page 100. For more information on se-
lecting custom groups, see “Custom groups navigation path” on page 293.
IMPORTANT:
P9000 Performance Advisor does not support the THP Pool RG Utilization and LDEV RG Utilization
metrics. Thus, you cannot plot a chart using these metrics. Favorite charts that are plotted earlier using
these metrics will be removed when you upgrade from any previous version to P9000 Performance
Advisor v5.4.
XP or P9000 disk arrays monitored by P9000 Performance Advisor
Each XP or P9000 disk array can be identified by its DKC or model number. If user-friendly name is
provided, it appears in brackets beside the DKC number. The components in an XP or a P9000 disk
array are logically grouped in the following main categories:
HP StorageWorks P9000 Performance Advisor Software User Guide 265