
HP StorageWorks P9000 Performance Advisor Software v5.4 User Guide (T1789-96328, April 2012)

DescriptionXP or P9500 Disk Array main categories – component se-
lection tree
Comprises of volumes that are used in the business copy or the
continuous access transactions. The business copy volumes comprise
of individual physical LDEVs. The continuous access volumes
comprise of the journal pools that have LDEVs configured to be
part of the journal pools. The continuous access volumes can be
configured on the P9000 disk arrays, such as the P9500.
They can also be configured on the XP24000, XP12000, XP10000,
SVS200, XP20000, and the SVS400 Disk Arrays. For more
information, see “Replication Volumes navigation
path” on page 284.
Replication Volumes
Comprises of the individual LUSE masters that have set of associated
components (LDEVs). For more information, see “LUSE navigation
path” on page 285.
LUSE
Comprises of the individual host groups that display the associated
ports, RAID groups, and LDEVs. Additionally, MP blades are also
displayed for a P9000 disk array. For more information, see “Host
Groups navigation path” on page 287.
Host Groups
Comprises of the external RAID groups that are managed by the
XP and P9000 disk arrays. For more information, see “Ext-RG(s)
navigation path” on page 291.
Ext-RG(s)
Comprises of the individual drive types that are available on the
selected XP and P9000 disk arrays. Also, includes the RAID groups
for each of the drive types. The RAID groups further display the list
of associated physical LDEVs. For more information, see “Drive
types navigation path” on page 292.
Drive Types
The above categorization helps you to view the overall performance of an XP or a P9000 disk array
through various channels of selection.
For example, if your application's response time is high, following is one of the ways to identify the
issue in the XP disk array that is processing your application requests:
1. Plot the performance graphs of all the ports (Front-end > Ports) to identify the port that is doing
maximum I/Os.
2. For that port, identify the associated host (Host Groups > Host > Ports).
3. For that host, plot performance graphs of all the LDEVs and identify the LDEV that is contributing
to the observed high response time.
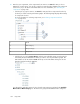
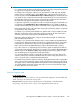
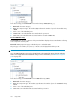
Click the plus (+) sign for a main category to navigate through the associated components and view
their performance graphs for the selected metrics. The components of the same type are grouped
together. Each component further expands to a subset of components depending on its level of
hierarchy in the component selection tree. For example, one of the hierarchy of component selection
for an XP or a P9000 disk array under Host Groups is as follows: Host Groups > Individual host
groups > Ports > Individual Ports > LDEVs > Individual LDEVs.
• Host Groups is the main category that displays the individual host groups.
• Each host group displays a set of associated ports that are grouped in the component type, Ports.
• Each port further displays a set of associated LDEVs under the component type, LDEVs.
HP StorageWorks P9000 Performance Advisor Software User Guide 267