
HP StorageWorks P9000 Performance Advisor Software v5.4 User Guide (T1789-96328, April 2012)

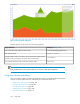
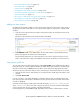
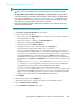
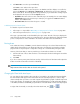

Figure 29 Average Metric Utilization
.
Place the pointer over an area to view the following details:
Example (see Figure 29)Aggregate Data
53040,CL1B(Fibre(Target)),Maximum)XP or P9000 disk array, component, metric name)
07/07/11, 14:06:00Date and time stamp
12110 (68.4%)
Average utilization metrics value for the specific date and time stamp (average
utilization metrics percentage for the specific date and time stamp)
total: 17709Sum of all the data points for the specific date and time stamp
NOTE:
In the stacked chart view, the system enables you to select more than eight components.
Using chart controls and settings
After a performance graph is plotted in the Chart Work Area, you can perform the following tasks
using the controls provided in the top and bottom pane of the Chart Work Area.
• “Adding new chart windows” on page 305
• “Saving charts as PDF files” on page 305
• “Saving favorite charts” on page 306
• “Loading favorite charts” on page 307
• “Forecasting utilization” on page 312
Using charts304