
HP StorageWorks P9000 Performance Advisor Software v5.4 User Guide (T1789-96328, April 2012)
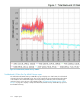
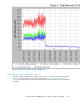
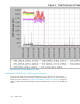
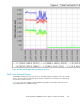
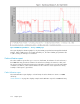
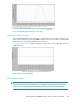
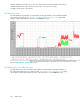

Figure 50 RAID Group Utilization — First top 8 RAID groups
.
The report displays the utilization graphs for only those RAID groups that have managed the backend
transfers. When a RAID group is associated with a ThP pool, the extent of RAID group utilization due
to I/Os occurring on a ThP pool is considered.
Cache utilization report
The cache utilization reports allow you to view in a chart format, the utilization of cache in the XP or
the P9000 disk array, the amount of data in the cache that is waiting to be written to a disk, read
hits as a percentage of total read operations, the total number of transfers per second, the total number
of transfers over 24-hour, cache side file utilization for the continuous access asynchronous activity.
A sample of each report is given below:
Cache Utilization report
The Cache Utilization report displays in a chart format, the cache utilization in an XP or a P9000
disk array.
“Cache Utilization” on page 417 displays a sample Cache Utilization report for a P9500 Disk Array.
Sample reports416