
HP Integrated Archive Platform Performance Graphs and Counters Whitepaper

5
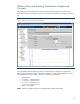
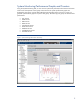
System Monitoring Performance Graphs and Counters
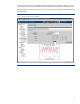
Using the System Monitoring Tab, we can view the system level performance and resource utilization
of the servers that operate as host groups within the IAP. The system performance graphs are
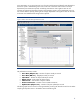
displayed by host group. Use the Select Machine Type drop-down menu as shown in Figure 3 to
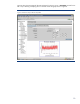
generate a performance graph for a specific host group. The following host groups are monitored for
performance:
• PCC Servers
• SMTP Servers
• HTTP Servers
• META Servers
• Cloud Router Servers
• Email Miner Server
• Database Servers
• Load Balancer Servers
• SmartCell Servers
Figure 3. System Monitoring Performance Host Groups