
HP StorageWorks Reference Information Storage System V1.0 Administrator Guide (May 2004)

LO
Chapter 2:
Persist Control Center
PCC Views, Detailed Descriptions
2-42 HP StorageWorks Reference Information Storage System Administrator Guide, April 2004
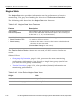
Nagios Stats
The
Nagios Stats
view provides information on the performance of service
monitoring. The gray-box heading for this view is
Performance Information
.
The following table describes the
Nagios Stats
view features.
The
Passive Service Checks
charts are
not used
; all PCC service checks are
active.
Related Views
•
Hostgroup Information
, page 2-100, presents the same monitoring
performance information, but for only a single host group (and it lets
you execute host group commands).
•
Tactical Overview
, page 2-21, also provides (limited) information on
monitoring performance.
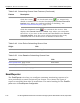
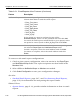
Table 2-45: Nagios Stats
View Features
Feature Description
Time Frame/
Checks Completed
The number and percentage of PCC services checked in
each of the indicated time frames (since PCC startup or
in the last 1, 5, 15, or 60 minutes).
Metric/Min/Max/Average
• Check Execution Time
• Check Latency
The minimum, maximum and average times
• it took to check a service
• between the time a service check was scheduled and
the time it was executed
(Percent State Change is
not used
.)
Table 2-46: Links
To
the Nagios Stats View
Origin Link
left menu Nagios Stats
Tactical Overview
, page 2-21 Monitoring Performance