
HP StorageWorks Reference Information Storage System V1.0 Administrator Guide (May 2004)

PCC Views, Detailed Descriptions Chapter 2:
Persist Control Center
HP StorageWorks Reference Information Storage System Administrator Guide, April 2004 2-57
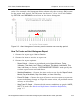
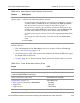
The following tables describe the various availability reports.
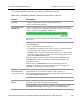
Table 2-56: Availability Report Features, Single Host or Service
Feature Description
heading • Name of the host or service name reported on.
• The covered report period.
Host/Service State
Breakdowns
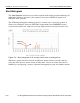
A color-coded history chart indicating the host/service status
value trends over the reported time period. This is a reduced
version of the corresponding Trends view.
Click the bar chart to display the full Trends view – see
Trends
,
page 2-51.
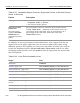
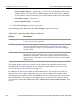
A chart indicating, for each host or service status value, and for
each Type/Reason:
• Time – Duration of the status value.
• % Total Time – Duration of the status value, as a percentage of
the total time since startup of PCC monitoring.
• % Known Time – Duration of the status value, as a percentage
of the total time since startup of PCC monitoring minus the
time with Undetermined status.
Each determined status value is divided into Scheduled and
Unscheduled periods, depending on whether downtime was
scheduled or not.
Status can be Undetermined because monitoring was not
running at the time, or because there was not enough data
available to determine the status value.
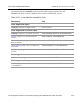
State Breakdowns
For Host Services
(host report only)
For each service running on the host, the percent of total
elapsed time for each service status value. Values in
parentheses represent percentages of the total time minus the
time with Undetermined status.
Click a service name to view the service Availability report.
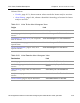
Host/Service Log
Entries
For each host/service event, event start and end time,
duration, type, and descriptive information
Click the link to toggle between viewing only problem events
(condensed log entries) and all logged events (full log entries).