
HP StorageWorks Reference Information Storage System V1.0 Administrator Guide (May 2004)

LO
Chapter 2:
Persist Control Center
PCC Views, Detailed Descriptions
2-60 HP StorageWorks Reference Information Storage System Administrator Guide, April 2004
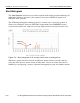
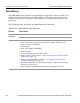
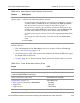
Alert Histogram
The
Alert Histogram
view lets you create reports with simple graphs showing, for
individual hosts or services, the number of events of different types over
different time periods.
The following histogram shows all service events over a one-day period. It
shows, for example, that two
CRITICAL
events and three
WARNING
events
occurred around 6:45, and two recovery (
OK
) events occurred around 7:00.
Figure 2-2: Alert histogram of all service events over one-day period
Whenever graph lines for events of different status values overlap exactly,
only the most severe status value is indicated. To see an event line that is
hidden by overlapping, create a separate histogram for just the hidden status
OK
Warning
Critical