
HP StorageWorks Fabric OS 5.X Advanced Web Tools Administrator Guide (AA-RVHYB-TE, September 2005)


Fabric OS 5.x Advanced Web Tools administrator guide 129
13 Monitoring performance
This chapter contains the following sections:
• Monitoring performance using Advanced Web Tools, page 129
• Launching the Performance Monitor module, page 132
• Creating a basic Performance Monitor graph, page 132
• Customizing basic Performance Monitor graphs, page 133
• Creating advanced Performance Monitor graphs, page 134
• Managing performance graphs, page 137
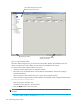
Monitoring performance using Advanced Web Tools
The Advanced Web Tools Performance Monitor module graphically displays throughput (in megabytes
per second) for each port and for the entire switch.
IMPORTANT: The basic-mode Performance Monitor is standard in the Advanced Web Tools software.
The Advanced Monitoring menu in Performance Monitor is optional licensed software.
Use the basic-mode Performance Monitor module to:
• Create user-definable reports.
• Display a performance canvas for application-level or fabric-level views.
• Save persistent graphs across reboots (saves parameter data across reboots).
Using HP Advanced Performance Monitoring, you can display predefined reports for AL_PA, EE, and
filter-based performance monitoring. You can track:
• The number of CRC errors for AL_PA devices
• The number of words received and transmitted in Fibre Channel frames with a defined source
ID/destination ID (S_ID/D_ID) pair
• The number of times a particular filter pattern in a frame is transmitted by a port
For detailed information on these types of performance monitoring, see the HP StorageWorks Fabric OS
5.x administrator guide.
Each graph is displayed individually in a window, so it can be minimized, maximized, resized, and
closed.
Graphs within the Performance Monitor module are updated every 30 seconds. When you first display the
graph, or if you modify the graph (to add additional ports, for example), you might have to wait up to 30
seconds before the new values appear.
When you have multiple graphs open in the Performance Monitor module, you can:
• Select Tile from the Window menu to view all graphs at once, tiled in the Performance Monitor
module.
• Select Cascade from the Window menu to view one graph at a time.
• Select Close All to close all open Performance Monitor graphs in the Performance Monitor module.
In addition, the Window menu lists all open graphs. You can select a graph name from the Window
menu to bring that graph to the front view when the graphs are cascaded, and to select the window for
that graph when the graphs are tiled.
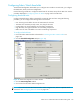
Predefined performance graphs
Advanced Web Tools predefines basic graph types, to simplify performance monitoring. A wide range of
EE fabric, LUN, device, and port metrics graphs are included. Table 12 lists the basic monitoring graphs
available. Table 13 lists the advanced monitoring graphs. The advanced monitoring graphs give more