
HP StorageWorks Fabric OS 5.X Advanced Web Tools Administrator Guide (AA-RVHYB-TE, September 2005)


130 Monitoring performance
detailed performance information to help you manage your fabric. You can access the basic monitoring
graphs on all switches; advanced monitoring graphs are available only on switches that have an HP
Advanced Performance Monitoring license activated.
The labeling of axes in the graphs depends on the switch type. For the Core Switch 2/64, SAN Director
2/128, and 4/256 SAN Director, slot numbers are displayed with expansion arrows next to them. Click
the arrows to expand and contract the list of ports per slot. For the 4/8 SAN Switch, 4/16 SAN Switch,
SAN Switch 2/8V, SAN Switch 2/16V, SAN Switch 2/32, 4Gb SAN Switch for HP p-Class
BladeSystem, and SAN Switch 4/32, slot numbers are not identified.
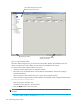
Figure 50 shows how to access the list of Advanced Performance Monitoring graphs using Advanced
Web Tools. This example displays the graphs available in the Performance Monitor module for a SAN
Director 2/128 with the Advanced Performance Monitoring license installed. Note that the slot number is
identified.
Table 12 Basic performance graphs
Graph type Description
Port Throughput Displays the performance of a port, in bytes per second, for frames received
and transmitted.
Switch Aggregate Throughput Displays the aggregate performance of all ports on a switch.
Blade Aggregate Throughput Displays the aggregate performance of all ports on a port card. This graph
is available only for the Core Switch 2/64, SAN Director 2/128, and
4/256 SAN Director.
Switch Throughput Utilization Displays the port throughput at the time the sample is taken. For the Core
Switch 2/64, SAN Director 2/128, and 4/256 SAN Director, this graph
displays the throughput for each slot. You can customize this graph to
display information for particular ports.
Port Error Displays a line of CRC errors for a given port.
Switch Percent Utilization Displays the percentage utilization for each port in a switch. For the Core
Switch 2/64, SAN Director 2/128, and 4/256 SAN Director, this graph
displays the percent utilization for each slot. You can customize this graph
to display information for particular ports.
Port Snapshot Error Displays the CRC error count between sampling periods for all the ports on
a switch. For the Core Switch 2/64, SAN Director 2/128, and 4/256 SAN
Director, this graph displays the CRC error rate for each slot. You can
customize this graph to display information for particular ports.
Table 13 Advanced performance monitoring graphs
Graph type Description
SID/DID Performance Displays the traffic between the SID-DID pair on the switch being
managed. For more information, see ”Creating an SID/DID
performance graph” on page 134.
SCSI vs. IP Traffic Displays percentage of SCSI versus IP frame traffic on each individual
port. For more information, see Creating a SCSI vs. IP traffic graph,
page 136.
AL_PA Errors Displays CRC errors for a given port and a given AL_PA. For more
information, see Creating an AL_PA error graph, page 137.
SCSI Commands by port and
LUN (R, W, R/W)
Displays the total number of read/write commands on a given port to a
specific LUN. For more information, see Creating a SCSI command
graph, page 136.