
HP StorageWorks Fabric OS 5.X Advanced Web Tools Administrator Guide (AA-RVHYB-TE, September 2005)


Fabric OS 5.x Advanced Web Tools administrator guide 53
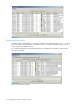
Displaying switch events
1. Click the switch from the Fabric Tree.
The Switch View opens.
2. Click the Events button on the Switch View.
The Switch Events window is displayed (see Figure 14 on page 52).
3. Optional: Click the column head to sort the events by a particular column.
Drag the column divider to resize a column.
You can also filter events, as described in Filtering fabric and switch events next.
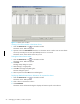
Filtering fabric and switch events
You can filter the events in the Fabric Events window and Switch Events window by time, severity,
message ID, and service. You can apply either one type of filter at a time or multiple types of filters at the
same time. The Switch Events and Fabric Events windows both have a Filter button. Click the Filter button
to display the Event Filter dialog box (see Figure 15).
When a filter is applied, the Show All button is active in the events window and the type of filter applied
is identified at the top of the events window (see Figure 14 on page 52). To unapply a filter, click the
Show All button in the events window.
NOTE: For two-switch configurations, clicking the Events button for a given switch filters out switch
service events from the other switch. Chassis service is shown in both events lists.
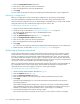
Figure 15 Event Filter dialog box
Filtering events by time intervals
1. Launch the Fabric Events or Switch Events window as described in ”Displaying fabric events” on
page 51 and ”Displaying switch events” on page 52.
2. Click Filter.
The Event Filter dialog box opens.