
AB291A Fabric Clustering System Support Guide (12-port Switch), April 2004
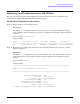
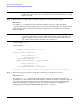
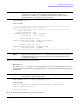

Table Of Contents
- About This Document
- 1 Introduction to Technology
- 2 Hardware Overview
- 3 Installation Planning
- 4 Installing HP Fabric Clustering System
- 5 Administration and Management
- HP-UX Host Administration and Management
- Switch Administration and Management
- CLI Overview
- Using the CLI
- Advanced Switch Setup
- Configuration, Image, and Log Files
- Configuration, Image, and Log File Overview
- File Management
- Listing Configuration, Image, and Log Files
- Viewing Configuration Files
- Viewing Log Files
- Saving Configuration Files
- Saving for System Reboot
- Saving the Backup Configuration
- Specifying the Configuration to Use at
- Saving and Copying Files
- Downloading Files to the System
- Deleting Configuration, Image, and Log Files
- Managing Log Files
- Understanding the Log Format
- Uploading Log Files
- Administering the System
- 6 Monitoring and Troubleshooting
- A Specifications
- B HP 12-Port 4X Fabric Copper Switch Commands
- Show Commands
- show arp ethernet
- show arp IB
- show authentication
- show backplane
- show boot-config
- show card
- show card-inventory
- show clock
- show config
- show fan
- show host
- show ib
- show ib sm configuration
- show ib sm multicast
- show ib sm neighbor
- show ib sm node subnet-prefix
- show ib sm partition
- show ib sm port
- show ib sm service
- show ib sm switch
- show ib-agent channel-adapter
- show ib-agent summary
- show ib-agent switch
- show ib-agent switch linear-frd-info
- show ib-agent switch all mcast-info lid
- show ib-agent switch all node-info
- show ib-agent switch all pkey-info
- show ib-agent switch port-info
- show ib-agent switch sl-vl-map
- show ib-agent switch switch-info
- show interface ib
- show interface ib sm
- show interface ib sm statistics
- show interface mgmt-ethernet
- show interface mgmt-ib
- show interface mgmt-serial
- show ip
- show location
- show logging
- show ntp
- show power-supply
- show running-status
- show sensor
- show snmp
- show system-services
- show terminal
- show trace
- show user
- show version
- IP Commands
- HP Fabric Clustering System Commands
- Administrative Commands
- action
- boot-config
- broadcast
- card
- clock
- configure
- copy
- delete
- dir
- disable
- enable
- exec
- exit
- ftp-server enable
- gateway
- help
- history
- hostname
- install
- interface
- interface mgmt-ethernet
- interface mgmt-ib
- ip
- location
- login
- logging
- logout
- more
- ntp
- ping
- radius-server
- reload
- shutdown
- snmp-server
- telnet
- terminal length
- terminal time-out
- trace
- type
- username
- who
- write
- Show Commands
- C How to Use Windows HyperTerminal
- Glossary

Chapter 6
Monitoring and Troubleshooting
Monitoring and Troubleshooting the HP-UX Host
110
Run itutil -s.
Description: itutil -s displays statistics for fabric adapters, including transport and
performance statistics.
NOTE The example below shows one possible statistic result with the error value set to 1.
The rest of the statistic results show no unusual statistic reports because the error
values are equal to 0.
Syntax example: itutil -l fe80::2:c901:8a0:8a11 ib0 1
Output example:
========================================================================
Adapter Statistics :
========================================================================
Transport Statistics
------------------------------------------------------------------------
Responder - number of local length errors : 0
Requester - number of local length errors : 0
Responder - number of local QP operation errors : 0
Requester - number of local QP operation errors : 0
Responder - number of local protection errors : 0
Requester - number of local protection errors : 0
Responder - number of WR flushed errors : 0
Requester - number of WR flushed errors : 0
Requester - number of memory window bind errors : 0
Requester - number of bad response errors : 0
Responder - number of local access errors : 0
Requester - number of remote invalid request errors : 0
Requester - number of remote access errors : 0
Requester - number of remote operation errors : 0
Requester - number of transport retries exceeded errors : 0
Requester - number of RNR nak retries exceeded errors : 0
Requester - number of remote aborted errors : 0
Responder - number of out of sequence requests received : 0
Requester - number of out of sequence Naks received : 0
Responder - number of bad multicast packets received : 0
Num silent UD drops due to RNR : 0
Number of CQ overflows : 0
Number of EQ overflows : 0
Number of bad doorbells : 0
------------------------------------------------------------------------
Link/Physical Statistics
------------------------------------------------------------------------
Spigot identifer : 1
Link Symbol Errors : 0
Link Error Recovery : 0
Link Down : 0