
AB291A Fabric Clustering System Support Guide (12-port Switch), April 2004

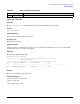
Table Of Contents
- About This Document
- 1 Introduction to Technology
- 2 Hardware Overview
- 3 Installation Planning
- 4 Installing HP Fabric Clustering System
- 5 Administration and Management
- HP-UX Host Administration and Management
- Switch Administration and Management
- CLI Overview
- Using the CLI
- Advanced Switch Setup
- Configuration, Image, and Log Files
- Configuration, Image, and Log File Overview
- File Management
- Listing Configuration, Image, and Log Files
- Viewing Configuration Files
- Viewing Log Files
- Saving Configuration Files
- Saving for System Reboot
- Saving the Backup Configuration
- Specifying the Configuration to Use at
- Saving and Copying Files
- Downloading Files to the System
- Deleting Configuration, Image, and Log Files
- Managing Log Files
- Understanding the Log Format
- Uploading Log Files
- Administering the System
- 6 Monitoring and Troubleshooting
- A Specifications
- B HP 12-Port 4X Fabric Copper Switch Commands
- Show Commands
- show arp ethernet
- show arp IB
- show authentication
- show backplane
- show boot-config
- show card
- show card-inventory
- show clock
- show config
- show fan
- show host
- show ib
- show ib sm configuration
- show ib sm multicast
- show ib sm neighbor
- show ib sm node subnet-prefix
- show ib sm partition
- show ib sm port
- show ib sm service
- show ib sm switch
- show ib-agent channel-adapter
- show ib-agent summary
- show ib-agent switch
- show ib-agent switch linear-frd-info
- show ib-agent switch all mcast-info lid
- show ib-agent switch all node-info
- show ib-agent switch all pkey-info
- show ib-agent switch port-info
- show ib-agent switch sl-vl-map
- show ib-agent switch switch-info
- show interface ib
- show interface ib sm
- show interface ib sm statistics
- show interface mgmt-ethernet
- show interface mgmt-ib
- show interface mgmt-serial
- show ip
- show location
- show logging
- show ntp
- show power-supply
- show running-status
- show sensor
- show snmp
- show system-services
- show terminal
- show trace
- show user
- show version
- IP Commands
- HP Fabric Clustering System Commands
- Administrative Commands
- action
- boot-config
- broadcast
- card
- clock
- configure
- copy
- delete
- dir
- disable
- enable
- exec
- exit
- ftp-server enable
- gateway
- help
- history
- hostname
- install
- interface
- interface mgmt-ethernet
- interface mgmt-ib
- ip
- location
- login
- logging
- logout
- more
- ntp
- ping
- radius-server
- reload
- shutdown
- snmp-server
- telnet
- terminal length
- terminal time-out
- trace
- type
- username
- who
- write
- Show Commands
- C How to Use Windows HyperTerminal
- Glossary

Chapter 6
Monitoring and Troubleshooting
Monitoring and Troubleshooting the Switch
122
• 0x10: This flow shows the Related Multipack Protocol (RMPP) related processing.
• 0x20: This flow shows the partition management related processing.
• 0x1000: This flow shows the internal state machine (may create more flow for more granularity for path,
mcast, …).
• 0x2000: This flow shows the user configuration management related processing.
• 0x4000: This flow triggers the fabric switch Subnet Manager to take a snap shot of the current logging
information for the trace.
For example, use:
• 0x4001 to take a snapshot of the SM logging information.
• 0x4002 to take a snapshot of the SA information.
• 0x8000: This flow triggers the MAD packet to be displayed.
For example, use:
• 0x8002 to display MAD packets and SA related processing.
• 0x8001 to display SM MAD packets and SM related processing.
Troubleshooting the HP Fabric Clustering System Network
Ping
As on any IP network, you can use the UNIX ping command to test connectivity between IPoIB
fabric-attached hosts. For more information, see “Verifying Connectivity” in Chapter 3.
Setting Trace Levels
Enabling Tracing Tracing is disabled by default. To set a trace level for the purpose of debugging or
troubleshooting, perform the following steps:
Step 1. Enter global-configuration mode.
HB-IB> enable
HB-IB configure
HB-IB(config)
Step 2. View the trace help output, as the number of applications and modules may have changed.
HP-IB(config)# trace app ?
app <1-25>
app numbers:
APP_ID_CLI = 1
APP_ID_OSPF = 2
APP_ID_RIP = 3
APP_ID_IP_AGENT = 22
APP_ID_FIB_AGENT = 23
APP_ID_KERNEL = 24
APP_ID_CARD_AGENT = 25
APP_ID_SM = 26