
Run Oracle OLTP workloads in HP-UX vPars and Integrity VM v6.1.5


10
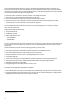
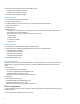
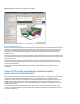
Figure 2. Swingbench Transaction Throughput screen snapshot
Vary the workload characteristics
Most Oracle databases experience different workload characteristics throughout the day, week, and month based on the
number of users attached to the database instance batch processing demands, and so on. Two of the more common
performance variables that change based on workload are the amount of physical disk I/O’s and the CPU utilization of
the database server. Baselines can be established by controlling the size of the Oracle dataset and the number of
Swingbench users.
The size of the Oracle dataset could be varied to test different physical disk I/O levels. A small dataset would require less
physical disk I/O after the dataset is fully populated in the Oracle SGA. A larger dataset would require more physical disk
I/O throughout the run.
Similarly, the number of Swingbench users could be varied in order to test different CPU utilization levels. A small
number of users would require less CPU resources on the system under test, whereas a large number of users would
demand more CPU utilization.
The benchmark effort, described in this white paper, is based on a single workload, which attempts to model a
realistic load.
Oracle OLTP testing methodology (used during this
performance characterization)
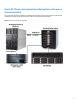
For this effort, Oracle workloads were run on the native BL890c i2 Integrity server, in a vPar guest, and in an HP Integrity
VM guest. The Integrity BL890c i2 Server Blade was booted using the same boot disk to assure identical Oracle
configuration for every run. A specific configuration (8 processors and 64 GB memory) was picked for all the runs. The
BL890c i2 server is larger (4 blades or 32 cores and 256 GB memory maximum) than the targeted platform, so the
configuration was adjusted to have just 8 active CPUs and 64 GB memory, to be able to be utilized by the server before
starting the workload runs.
The differences in Oracle TPS and the CPU utilization of “vPar vs. native” and “VM vs. native” blade, provide a rough
estimate of overhead associated with a given workload. The TPS numbers were taken from the AWR reports collected
during each workload run.