
HP-UX HB v13.00 Ch-22 - Performance and Tuning

HP-UX Handbook – Rev 13.00 Page 13 (of 19)
Chapter 22 Performance & Tuning
October 29, 2013
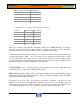
avserv Average time (in milliseconds) to service each transfer request
(includes seek, rotational latency, and data transfer times) for the device.
When average wait (avwait) is greater than average service time (avserv) it indicates the disk
can't keep up with the load during that sample.
When the average queue length exceeds the norm of 0.50 it is an indication of jobs stacking up.
When it reaches 1.0 the run queue is at saturation.
If the avserv is under 15mS ,the SCSI run queue depth can be increase from the default of 8. In
11.23 and prior releases this is a global kernel setting : scsi_max_qdepth .
In 11.31 it can be set via the scsimgr utility , specifying the max_q_depth attribute . Once the
service times exceed 15mS and the run queue is greater than 1.0 it is best to address the Physical
layer overload , i.e. spread the load across more physical paths.
If disks are observed with no apparent load but high service times , check the other disks
associated with that controller to see if they are experiencing high run queues. This can be a case
of controller saturation.
These conditions are considered to be a bottleneck. It is prudent to keep in mind how long these
conditions last. If the queue flushes, or the avwait clears in a reasonable time, (i.e. 5 seconds), it
is not a cause for concern.
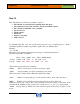
To determine the amount of reads and writes sar –c can be used :
# sar – c 5 100
scall/s sread/s swrit/s fork/s exec/s rchar/s wchar/s
Average 5449 521 290 0.84 0.66 1428448 3682636
Vxtunefs has options to address specific read and write parameter values.
Refer to the man (1M) vxtunefs for details
Keep in mind that the more jobs in a queue, the greater the effect on wait on I/O even if they are
small. Large jobs, those greater than 1000 blks/s will also affect throughput.
Also consider the type of disks being used. Modern disk arrays are capable of handling very
large amounts of data in very short processing times. Processing loads of 5000 blks/s or greater
in under 10mS. Older standard disks may show far less capability.
If a bottleneck is identified, run:
# strings /etc/lvmtab
to identify the volume group associated with the disks.