
HP Caliper 5.3 User Guide (5900-1558, February 2011)
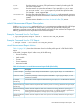
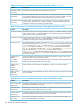
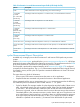
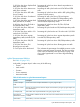
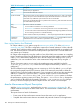
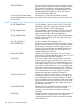
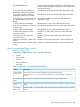
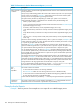

Table 16 Information in cstack Measurement Report Fields (Flat Profile) (continued)
DescriptionColumn
Total number of direct sample hits attributed to the given object.Wall-clock Samples
(Linux only)
Number of sample hits taken when a thread was waiting (divided into blocked and spinning)
on a thread level blocking primitive (mutex, read/write lock, or condition variable) or process
level blocking primitive (semaphore, message queue, socket, pipe, file descriptor).
Sample Hits Waiting
(HP-UX only)
Number of direct sample hits taken when a thread was waiting on a thread level blocking
primitive (mutex, read/write lock, or condition variable) or process level blocking primitive
(semaphore, message queue, socket, pipe, file descriptor).
Sample Hits Waiting
(Linux only)
Table 17 Information in cstack Measurement Report Fields (Blocking Primitives Profile)
DescriptionColumn
Percentage of total sample hits waiting (blocked or spinning) on a thread level blocking primitive
(mutex, read/write lock, or condition variable) or process level blocking primitive (semaphore,
message queue, socket, pipe, file descriptor).
% Total Hits Waiting
Sample hits taken when a thread was waiting (blocked or spinning) on a thread level blocking
primitive (mutex, read/write lock, or condition variable) or process level blocking primitive
(semaphore, message queue, socket, pipe, file descriptor).
Sample Hits Waiting
The name of the Blocking Primitive represented as <type>@{address|name}. The type can
be thread level blocking primitive mutex|cond-var|rwlock or inter process blocking primitive
sem_id (semaphore id) | msgq_id (message queue id) | sock_fd (socket descriptor) |
regular_fd (regular file descriptor) | char_dev_fd (character device file descriptor) |
blk_dev_fd (block device file descriptor) | pipe_fd (pipe descriptor) | reg_sock_fd
(regular socket descriptor) | stream_sock_fd (stream socket descriptor) |
multi_file_desc (multiple descriptor numbers for select, poll), <name> is a symbol associated
with the primitive, and <address> is the primitive's address (shown when the address cannot
be resolved to a symbol.
Blocking Primitive
Sample hits attributed to a thread that was holding a primitive (for example, a mutex) when
other threads were waiting on the same primitive.
Sample hits taken on a waiting thread that is blocked on the primitive held by the Holder thread
(Marked by kernel thread ID and hot call path index.)
Sample Hits for
Holder
--For Waiter
(HP-UX only)
Holder thread and waiter threads are identified by an index into Hot Call Path section.Callpath Index
Holder
--Waiter
(HP-UX only)
Holder thread's kernel thread suffixed with the the name of the routine that the thread will execute
once it is created.
Holder's Kernel
Thread ID
(HP-UX only)
Table 18 Information in cstack Measurement Report Fields (Hot Call Paths Profile)
DescriptionColumn
Percentage of total sample hits directly in the call path. This represents the percentage of the
total real time attributable to the call path.
% Run + Block Hits
(HP-UX only)
Percentage of run hits directly in the call path. This represents the percentage of the total real
time attributable to the call path that was in a run state.
% Run Hits Only
(HP-UX only)
Percentage of blocked hits directly in the call path. This represents the percentage of the total
real time attributable to the call path that was in a blocked state.
% Block Hits Only
(HP-UX only)
Percentage of total sample hits directly in the call path. This represents the percentage of the
total real time attributable to the call path.
Total Hits In Only
(Linux only)
182 Descriptions of Measurement Reports