
HP VAN SDN Controller Administrator Guide


34
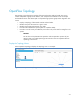
2. At this point either resume interaction with the controller, or click on the dropdown arrow
and take one of the indicated actions in the dropdown menu:
o Open a window showing the new log zip file.
o Set the default operation to always open the directory containing the log zip
file.
o Show the log zip file in the default directory for receiving downloads.
Note
The actions resulting from these choices are not managed by the controller but
are a function of the operating system in use.
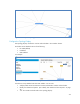
OpenFlow Monitor
When the controller is active in an OpenFlow domain, the OpenFlow Monitor enables tracking of
switch traffic summaries, packet traffic per port, and applied flow rules for switches detected in
the controller domain. The main display lists the Data Path IDs for the active switches and the
options for viewing traffic information.
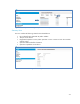
Figure 25 The Main OpenFlow Monitor Display
The main display includes:
Data Path ID: The OpenFlow data path identification for each detected OpenFlow switch.
These IDs also appear in the switch representations in the OpenFlow Topology display.
IP Address: The IP address associated with an OpenFlow data path instance.
Negotiated Version: The version of OpenFlow in use with the corresponding data path.
Discover Changes in the Topology
Click on Refresh periodically to update the display for topology changes, such as a newly
discovered OpenFlow device or the loss of a device that has failed.
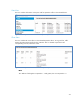
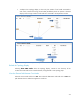
View Information for a Specific Device
Click on a Data Path ID to select a particular OpenFlow device. (For a graphical view of Data
Path ID assignments to individual OpenFlow switches, see "OpenFlow Topology" on page 37.
Selecting an ID activates the command menu for that specific data path. For example: