
HP Cache Server Appliance Administrator Guide

64
Chapter 9 Monitoring Traffic
where nodename is the name of the web cache appliance and adminport is the number assigned to Traffic
Manager port, port 8081 by default.
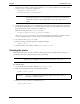
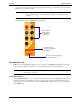
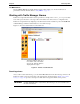
Traffic Manager displays the Monitor tab(shownbelow).
Using Monitor mode
In Monitor mode, Traffic Manager displays a series of buttons on the Monitor tab. Each button represents a
group of statistics. Click on a button to view its statistics. Each button is described briefly below.
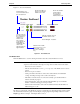
The Dashboard button
Click the Dashboard button to see a concise view of your Traffic Server system, displaying all cluster nodes
by name and tracking essential statistics for each node. If you want to display detailed information about a
particular node, you can click the node’s name on the Dashboard, and then click on one of the other buttons
on the Monitor tab.
NOTE Use the SSL
https command to reach Traffic Manager only if you have restricted
access to Traffic Manager via SSL connections; otherwise, use the standard
http
command.
NOTE All the statistics displayed in Monitor mode are described in detail in Appendix A‚
Traffic Manager Statistics.
Click a button to
display a page
listing statistics
you can view
Showsthe currentuserlogged
on to Traffic Manager
Click this button to
display a description of
the statistics