
HP Cache Server Appliance Administrator Guide

65
Chapter 9 Monitoring Traffic
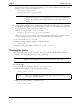
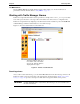
Figure 9-1. shows the Dashboard.
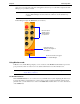
Figure 9-1. The Dashboard
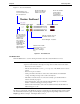
The Node button
Click the Node button to see the following information about the selected Traffic Server node:
ThenameofeachstatisticontheNode page appears as a link (the text is underlined). Click a link to display
the statistical information in a graph. You can display a single graph showing multiple statistics from the
Graphs page. Refer to Chapter , “The Graphs button,” below.
NOTE If the node is part of a cluster, two sets of statistics are shown: information about the
single node and information showing an average value for all the nodes in the cluster.
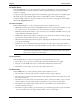
- If the node is active or inactive
- The date and time that the
traffic_server process on the Traffic Server node was
started
- If the node is part of a cluster
- Cache performance information, such as the document hit rate, the bandwidth
savings, and what percentage of the cache is currently free
- The number of client and server connections currently open and the number of
transfers currently in progress
- Network information, such as the client throughput in Mbits per second and the
number of transactions being processed per second
- Name resolution information, such as the host database hit rate and the number of
DNS lookups per second
Shows the number
of transactions
processed per
second by the
Traffic Server node
Shows the number of
objects served by the
Traffic Server node
Indicatesifalarmsexiston
the Traffic Server node:
Green OK light - no alarms.
Indicates if the Traffic
Server node is on or off
(if the traffic_server
process is running or
not)
Clickthislinktosee
more information about
the selected node
Lists the nodes in
the cluster. Select
the node whose
statistics you
want to view.
The selected
node appears in
black without
underlining. The
other nodes
appear in blue as
hypertext links.