
HP XC System Software Administration Guide Version 3.2
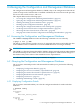

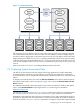
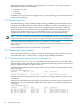

Figure 7-1 System Monitoring
The mond and syslog daemons run on every node. The Supermon service manages requests
for mond daemons that run on a subset of nodes. The mond daemon can be configured to pass
any metric data for aggregation to the parent Supermon service. The Nagios master and other
Nagios monitors run their check_metrics plug-in periodically, which causes Supermon data
collection and storage into the database. The Root Supermon also connects to all other Supermon
services and manages a subset of nodes. The syslog daemons report events to the syslog-ng
services
Other tools, such as collectl, work independently from this structure.
7.3 Displaying System Environment Data
The HP XC System Software uses the Nagios monitoring application to gather and display
environment data. The HP XC System Software provides plug-ins that monitor each node's
environment data, such as temperature and fan speed, which can be indicators of possible node
failure.
To display environment data, first select the Service Problems menu item in the left frame of
the Nagios main window, shown in Figure 8-2 (page 109), to open the Service Status for All
Hosts window.
For additional information about the Nagios Service Status for All Hosts window and related
topics, select Documentation on the Nagios menu, or visit the Nagios web address:
http://www.nagios.org
You can also use the shownode metrics sensors command to display environmental data.
See “Displaying System Sensors from the Command Line” (page 90) for more information.
Depending on the platform, there may be tools that allow you to collect information specific to
the platform. Typically, this same information is collected and available in the HP XC database
from the shownode metrics sensors command. For example, systems that support the iLO
7.3 Displaying System Environment Data 89