
HP XP P9000 Performance Advisor Software v5.5 User Guide (T1789-96337, Februrary 2013)
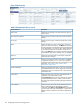

DescriptionScreen elements
Time Posted when one of the following conditions is
met:
◦ The alarm is disabled or there are no I/Os
transactions on the component.
◦ The performance of a component rises or drops
below the set threshold level.
• Time updated: If this option is selected, the time stamps
when HP XP P9000 Performance Advisor last collected
the latest performance values for all the components are
displayed.
• Time dispatched: If this option is selected, the time
stamps when HP XP P9000 Performance Advisor
dispatched the alarm notifications are displayed.
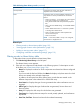
If a record is showing a blank entry for any of these time
stamps, that particular record is skipped during the filtering
phase. Assuming that the I/Os transactions are not
happening on a particular component, and the alarm is
also disabled. In such a case, the Time Updated displays
a blank entry for that component record. Hence, the record
is skipped when you filter based on Time Updated option.
This list displays the following options:Alarm Type
• All: This option is for viewing both the serious and the
recovery alarms.
• Recovery Alarm: This option is for viewing records that
are logged for alarm notifications dispatched after the
performance of a component dropped below the set
threshold limit.
• Serious Alarm: This option is for viewing records that
are logged for alarm notifications dispatched when the
performance of a component rises beyond the set
threshold limit. An alarm notification is dispatched only
the first time when the performance of a component
goes beyond the set threshold limits.
Select the start and end time range for filtering the
component records, from the respective calendars.
Start Time, End Time boxes
Related Topics
• “Understanding alarms history” (page 131)
• “Alarm History screen” (page 131)
• “Filtering records in Alarms History table” (page 133)
• “Viewing graph of metric value's performance” (page 135)
• “Adding or removing metric values” (page 117)
• “Configuring notification and monitoring settings” (page 119)
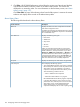
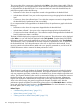
Viewing performance graphs for components
HP XP P9000 Performance Advisor logs a new record in the Alarms History table when either of
the following conditions are met:
• The performance of a component rises beyond the set threshold limit.
• The performance of a component drops below the set threshold limit.
Managing alarms history 135